In zpool replace, you can read about a drive which was giving errors and which I replaced.
At present, that drive is [still] giving these errors, but it not part of any spool.
[17:38 r730-03 dvl ~] % tail /var/log/messages
Dec 25 14:52:17 r730-03 smartd[15472]: Device: /dev/da6 [SAT], 18 Currently unreadable (pending) sectors
Dec 25 14:52:17 r730-03 smartd[15472]: Device: /dev/da6 [SAT], 18 Offline uncorrectable sectors
Dec 25 15:22:17 r730-03 smartd[15472]: Device: /dev/da6 [SAT], 18 Currently unreadable (pending) sectors
Dec 25 15:22:17 r730-03 smartd[15472]: Device: /dev/da6 [SAT], 18 Offline uncorrectable sectors
Dec 25 15:52:16 r730-03 smartd[15472]: Device: /dev/da6 [SAT], 18 Currently unreadable (pending) sectors
Dec 25 16:22:17 r730-03 syslogd: last message repeated 1 times
Dec 25 16:52:16 r730-03 syslogd: last message repeated 1 times
Dec 25 16:52:16 r730-03 smartd[15472]: Device: /dev/da6 [SAT], 18 Offline uncorrectable sectors
Dec 25 17:22:16 r730-03 smartd[15472]: Device: /dev/da6 [SAT], 18 Currently unreadable (pending) sectors
Dec 25 17:22:16 r730-03 smartd[15472]: Device: /dev/da6 [SAT], 18 Offline uncorrectable sectors
I’m going to read the whole drive, then write to all of it, just for fun. Can I clear those messages?
I’ve read where you can calculate the problem sectors and write to them. I’m not going to do that.
Furthermore, I may or may not RMA this drive (return it for credit). If I do, the write will effectively erase the disk. At least it will be wiped enough for my purposes.
The read
Here is my read process:
[13:20 r730-03 dvl ~] % sudo dd if=/dev/da6 of=/dev/null bs=1M
load: 0.26  cmd: dd 20010 [physrd] 1062.84r 0.47u 15.61s 1% 3440k
253528+0 records in
253528+0 records out
265843376128 bytes transferred in 1062.841947 secs (250125032 bytes/sec)
load: 0.05  cmd: dd 20010 [physrd] 15386.81r 5.55u 216.49s 0% 3440k
3525678+0 records in
3525678+0 records out
3696941334528 bytes transferred in 15386.813635 secs (240266856 bytes/sec)
The lines starting with load are the output from pressing CTRL-t. Based on the first output, I’m guessing this read will take about 14 hours. You do your own math.
Now, we wait.
These errors turned up:
Dec 25 18:16:00 r730-03 kernel: (da6:mrsas0:1:7:0): READ(10). CDB: 28 00 3d 7c 8e 45 00 00 45 00
Dec 25 18:16:00 r730-03 kernel: (da6:mrsas0:1:7:0): CAM status: SCSI Status Error
Dec 25 18:16:00 r730-03 kernel: (da6:mrsas0:1:7:0): SCSI status: OK
Dec 25 18:22:19 r730-03 smartd[15472]: Device: /dev/da6 [SAT], 19 Currently unreadable (pending) sectors (changed +1)
Dec 25 18:22:19 r730-03 smartd[15472]: Device: /dev/da6 [SAT], 18 Offline uncorrectable sectors
Dec 25 18:22:19 r730-03 smartd[15472]: Device: /dev/da6 [SAT], ATA error count increased from 18 to 20
Dec 25 18:52:17 r730-03 smartd[15472]: Device: /dev/da6 [SAT], 19 Currently unreadable (pending) sectors
Dec 25 18:52:17 r730-03 smartd[15472]: Device: /dev/da6 [SAT], 18 Offline uncorrectable sectors
Later, these:
Dec 26 00:22:16 r730-03 smartd[15472]: Device: /dev/da6 [SAT], 19 Currently unreadable (pending) sectors
Dec 26 00:22:16 r730-03 smartd[15472]: Device: /dev/da6 [SAT], 18 Offline uncorrectable sectors
Dec 26 00:44:02 r730-03 kernel: (da6:mrsas0:1:7:0): READ(10). CDB: 28 00 81 52 33 00 00 00 45 00
Dec 26 00:44:02 r730-03 kernel: (da6:mrsas0:1:7:0): CAM status: SCSI Status Error
Dec 26 00:44:02 r730-03 kernel: (da6:mrsas0:1:7:0): SCSI status: OK
Dec 26 00:52:17 r730-03 smartd[15472]: Device: /dev/da6 [SAT], 20 Currently unreadable (pending) sectors (changed +1)
Dec 26 00:52:17 r730-03 smartd[15472]: Device: /dev/da6 [SAT], 18 Offline uncorrectable sectors
Dec 26 00:52:17 r730-03 smartd[15472]: Device: /dev/da6 [SAT], ATA error count increased from 20 to 22
13:57
The next morning, the operation had completed. Based on the timestamp in the shell prompt, it had finished about 7 hour earlier.
[13:20 r730-03 dvl ~] % sudo dd if=/dev/da6 of=/dev/null bs=1M
load: 0.26  cmd: dd 20010 [physrd] 1062.84r 0.47u 15.61s 1% 3440k
253528+0 records in
253528+0 records out
265843376128 bytes transferred in 1062.841947 secs (250125032 bytes/sec)
load: 0.05  cmd: dd 20010 [physrd] 15386.81r 5.55u 216.49s 0% 3440k
3525678+0 records in
3525678+0 records out
3696941334528 bytes transferred in 15386.813635 secs (240266856 bytes/sec)
load: 0.29  cmd: dd 20010 [physrd] 17046.76r 6.07u 238.53s 0% 3440k
3884214+0 records in
3884214+0 records out
4072893579264 bytes transferred in 17046.768969 secs (238924666 bytes/sec)
load: 0.50  cmd: dd 20010 [physrd] 19866.79r 7.19u 274.91s 0% 3440k
4480673+0 records in
4480673+0 records out
4698326171648 bytes transferred in 19866.791258 secs (236491445 bytes/sec)
load: 0.12  cmd: dd 20010 [physrd] 43421.11r 14.40u 547.45s 0% 3440k
8870780+0 records in
8870780+0 records out
9301687009280 bytes transferred in 43421.114858 secs (214220364 bytes/sec)
11444224+0 records in
11444224+0 records out
12000138625024 bytes transferred in 62014.346335 secs (193505847 bytes/sec)
[6:34 r730-03 dvl ~] %
The messages persist within /var/log/messages:
Dec 26 13:52:17 r730-03 smartd[15472]: Device: /dev/da6 [SAT], 32 Currently unreadable (pending) sectors
Dec 26 13:52:17 r730-03 smartd[15472]: Device: /dev/da6 [SAT], 18 Offline uncorrectable sectors
Oh and we got many more errors:
Dec 26 06:32:09 r730-03 kernel: (da6:mrsas0:1:7:0): READ(10). CDB: 28 00 ae 9f e2 8a 00 00 45 00
Dec 26 06:32:09 r730-03 kernel: (da6:mrsas0:1:7:0): CAM status: SCSI Status Error
Dec 26 06:32:09 r730-03 kernel: (da6:mrsas0:1:7:0): SCSI status: OK
Dec 26 06:32:14 r730-03 kernel: (da6:mrsas0:1:7:0): READ(10). CDB: 28 00 ae 9f eb 8a 00 00 45 00
Dec 26 06:32:14 r730-03 kernel: (da6:mrsas0:1:7:0): CAM status: SCSI Status Error
Dec 26 06:32:14 r730-03 kernel: (da6:mrsas0:1:7:0): SCSI status: OK
Dec 26 06:32:17 r730-03 kernel: (da6:mrsas0:1:7:0): READ(10). CDB: 28 00 ae 9f eb cf 00 00 31 00
Dec 26 06:32:17 r730-03 kernel: (da6:mrsas0:1:7:0): CAM status: SCSI Status Error
Dec 26 06:32:17 r730-03 kernel: (da6:mrsas0:1:7:0): SCSI status: OK
Dec 26 06:32:23 r730-03 kernel: (da6:mrsas0:1:7:0): READ(10). CDB: 28 00 ae 9f ed 8a 00 00 45 00
Dec 26 06:32:23 r730-03 kernel: (da6:mrsas0:1:7:0): CAM status: SCSI Status Error
Dec 26 06:32:23 r730-03 kernel: (da6:mrsas0:1:7:0): SCSI status: OK
Dec 26 06:32:28 r730-03 kernel: (da6:mrsas0:1:7:0): READ(10). CDB: 28 00 ae 9f ee cf 00 00 31 00
Dec 26 06:32:28 r730-03 kernel: (da6:mrsas0:1:7:0): CAM status: SCSI Status Error
Dec 26 06:32:28 r730-03 kernel: (da6:mrsas0:1:7:0): SCSI status: OK
Dec 26 06:32:34 r730-03 kernel: (da6:mrsas0:1:7:0): READ(10). CDB: 28 00 ae 9f ef cf 00 00 31 00
Dec 26 06:32:34 r730-03 kernel: (da6:mrsas0:1:7:0): CAM status: SCSI Status Error
Dec 26 06:32:34 r730-03 kernel: (da6:mrsas0:1:7:0): SCSI status: OK
Dec 26 06:32:40 r730-03 kernel: (da6:mrsas0:1:7:0): READ(10). CDB: 28 00 ae 9f f0 45 00 00 45 00
Dec 26 06:32:40 r730-03 kernel: (da6:mrsas0:1:7:0): CAM status: SCSI Status Error
Dec 26 06:32:40 r730-03 kernel: (da6:mrsas0:1:7:0): SCSI status: OK
Dec 26 06:32:45 r730-03 kernel: (da6:mrsas0:1:7:0): READ(10). CDB: 28 00 ae 9f f1 45 00 00 45 00
Dec 26 06:32:45 r730-03 kernel: (da6:mrsas0:1:7:0): CAM status: SCSI Status Error
Dec 26 06:32:45 r730-03 kernel: (da6:mrsas0:1:7:0): SCSI status: OK
Dec 26 06:32:48 r730-03 kernel: (da6:mrsas0:1:7:0): READ(10). CDB: 28 00 ae 9f f1 8a 00 00 45 00
Dec 26 06:32:48 r730-03 kernel: (da6:mrsas0:1:7:0): CAM status: SCSI Status Error
Dec 26 06:32:48 r730-03 kernel: (da6:mrsas0:1:7:0): SCSI status: OK
Dec 26 06:32:54 r730-03 kernel: (da6:mrsas0:1:7:0): READ(10). CDB: 28 00 ae 9f f2 8a 00 00 45 00
Dec 26 06:32:54 r730-03 kernel: (da6:mrsas0:1:7:0): CAM status: SCSI Status Error
Dec 26 06:32:54 r730-03 kernel: (da6:mrsas0:1:7:0): SCSI status: OK
Dec 26 06:32:59 r730-03 kernel: (da6:mrsas0:1:7:0): READ(10). CDB: 28 00 ae 9f f4 45 00 00 45 00
Dec 26 06:32:59 r730-03 kernel: (da6:mrsas0:1:7:0): CAM status: SCSI Status Error
Dec 26 06:32:59 r730-03 kernel: (da6:mrsas0:1:7:0): SCSI status: OK
Dec 26 06:33:02 r730-03 kernel: (da6:mrsas0:1:7:0): READ(10). CDB: 28 00 ae 9f f4 cf 00 00 31 00
Dec 26 06:33:02 r730-03 kernel: (da6:mrsas0:1:7:0): CAM status: SCSI Status Error
Dec 26 06:33:02 r730-03 kernel: (da6:mrsas0:1:7:0): SCSI status: OK
Dec 26 06:33:08 r730-03 kernel: (da6:mrsas0:1:7:0): READ(10). CDB: 28 00 ae 9f f5 00 00 00 45 00
Dec 26 06:33:08 r730-03 kernel: (da6:mrsas0:1:7:0): CAM status: SCSI Status Error
Dec 26 06:33:08 r730-03 kernel: (da6:mrsas0:1:7:0): SCSI status: OK
Dec 26 06:33:13 r730-03 kernel: (da6:mrsas0:1:7:0): READ(10). CDB: 28 00 ae 9f f6 cf 00 00 31 00
Dec 26 06:33:13 r730-03 kernel: (da6:mrsas0:1:7:0): CAM status: SCSI Status Error
Dec 26 06:33:13 r730-03 kernel: (da6:mrsas0:1:7:0): SCSI status: OK
Dec 26 06:33:19 r730-03 kernel: (da6:mrsas0:1:7:0): READ(10). CDB: 28 00 ae 9f f8 8a 00 00 45 00
Dec 26 06:33:19 r730-03 kernel: (da6:mrsas0:1:7:0): CAM status: SCSI Status Error
Dec 26 06:33:19 r730-03 kernel: (da6:mrsas0:1:7:0): SCSI status: OK
Dec 26 06:33:24 r730-03 kernel: (da6:mrsas0:1:7:0): READ(10). CDB: 28 00 ae 9f f9 cf 00 00 31 00
Dec 26 06:33:24 r730-03 kernel: (da6:mrsas0:1:7:0): CAM status: SCSI Status Error
Dec 26 06:33:24 r730-03 kernel: (da6:mrsas0:1:7:0): SCSI status: OK
Dec 26 06:33:27 r730-03 kernel: (da6:mrsas0:1:7:0): READ(10). CDB: 28 00 ae 9f f9 8a 00 00 45 00
Dec 26 06:33:27 r730-03 kernel: (da6:mrsas0:1:7:0): CAM status: SCSI Status Error
Dec 26 06:33:27 r730-03 kernel: (da6:mrsas0:1:7:0): SCSI status: OK
Dec 26 06:33:33 r730-03 kernel: (da6:mrsas0:1:7:0): READ(10). CDB: 28 00 ae 9f fa cf 00 00 31 00
Dec 26 06:33:33 r730-03 kernel: (da6:mrsas0:1:7:0): CAM status: SCSI Status Error
Dec 26 06:33:33 r730-03 kernel: (da6:mrsas0:1:7:0): SCSI status: OK
Dec 26 06:33:38 r730-03 kernel: (da6:mrsas0:1:7:0): READ(10). CDB: 28 00 ae 9f fb 8a 00 00 45 00
Dec 26 06:33:38 r730-03 kernel: (da6:mrsas0:1:7:0): CAM status: SCSI Status Error
Dec 26 06:33:38 r730-03 kernel: (da6:mrsas0:1:7:0): SCSI status: OK
Dec 26 06:33:44 r730-03 kernel: (da6:mrsas0:1:7:0): READ(10). CDB: 28 00 ae 9f fc 45 00 00 45 00
Dec 26 06:33:44 r730-03 kernel: (da6:mrsas0:1:7:0): CAM status: SCSI Status Error
Dec 26 06:33:44 r730-03 kernel: (da6:mrsas0:1:7:0): SCSI status: OK
Dec 26 06:33:47 r730-03 kernel: (da6:mrsas0:1:7:0): READ(10). CDB: 28 00 ae 9f fc 00 00 00 45 00
Dec 26 06:33:47 r730-03 kernel: (da6:mrsas0:1:7:0): CAM status: SCSI Status Error
Dec 26 06:33:47 r730-03 kernel: (da6:mrsas0:1:7:0): SCSI status: OK
Dec 26 06:33:49 r730-03 kernel: (da6:mrsas0:1:7:0): READ(10). CDB: 28 00 ae 9f fc 8a 00 00 45 00
Dec 26 06:33:49 r730-03 kernel: (da6:mrsas0:1:7:0): CAM status: SCSI Status Error
Dec 26 06:33:49 r730-03 kernel: (da6:mrsas0:1:7:0): SCSI status: OK
Dec 26 06:33:55 r730-03 kernel: (da6:mrsas0:1:7:0): READ(10). CDB: 28 00 ae 9f fe 00 00 00 45 00
Dec 26 06:33:55 r730-03 kernel: (da6:mrsas0:1:7:0): CAM status: SCSI Status Error
Dec 26 06:33:55 r730-03 kernel: (da6:mrsas0:1:7:0): SCSI status: OK
Dec 26 06:34:01 r730-03 kernel: (da6:mrsas0:1:7:0): READ(10). CDB: 28 00 ae 9f ff 00 00 00 45 00
Dec 26 06:34:01 r730-03 kernel: (da6:mrsas0:1:7:0): CAM status: SCSI Status Error
Dec 26 06:34:01 r730-03 kernel: (da6:mrsas0:1:7:0): SCSI status: OK
Dec 26 06:34:04 r730-03 kernel: (da6:mrsas0:1:7:0): READ(10). CDB: 28 00 ae 9f ff cf 00 00 31 00
Dec 26 06:34:04 r730-03 kernel: (da6:mrsas0:1:7:0): CAM status: SCSI Status Error
Dec 26 06:34:04 r730-03 kernel: (da6:mrsas0:1:7:0): SCSI status: OK
Dec 26 06:52:17 r730-03 smartd[15472]: Device: /dev/da6 [SAT], 32 Currently unreadable (pending) sectors (changed +12)
Dec 26 06:52:17 r730-03 smartd[15472]: Device: /dev/da6 [SAT], 18 Offline uncorrectable sectors
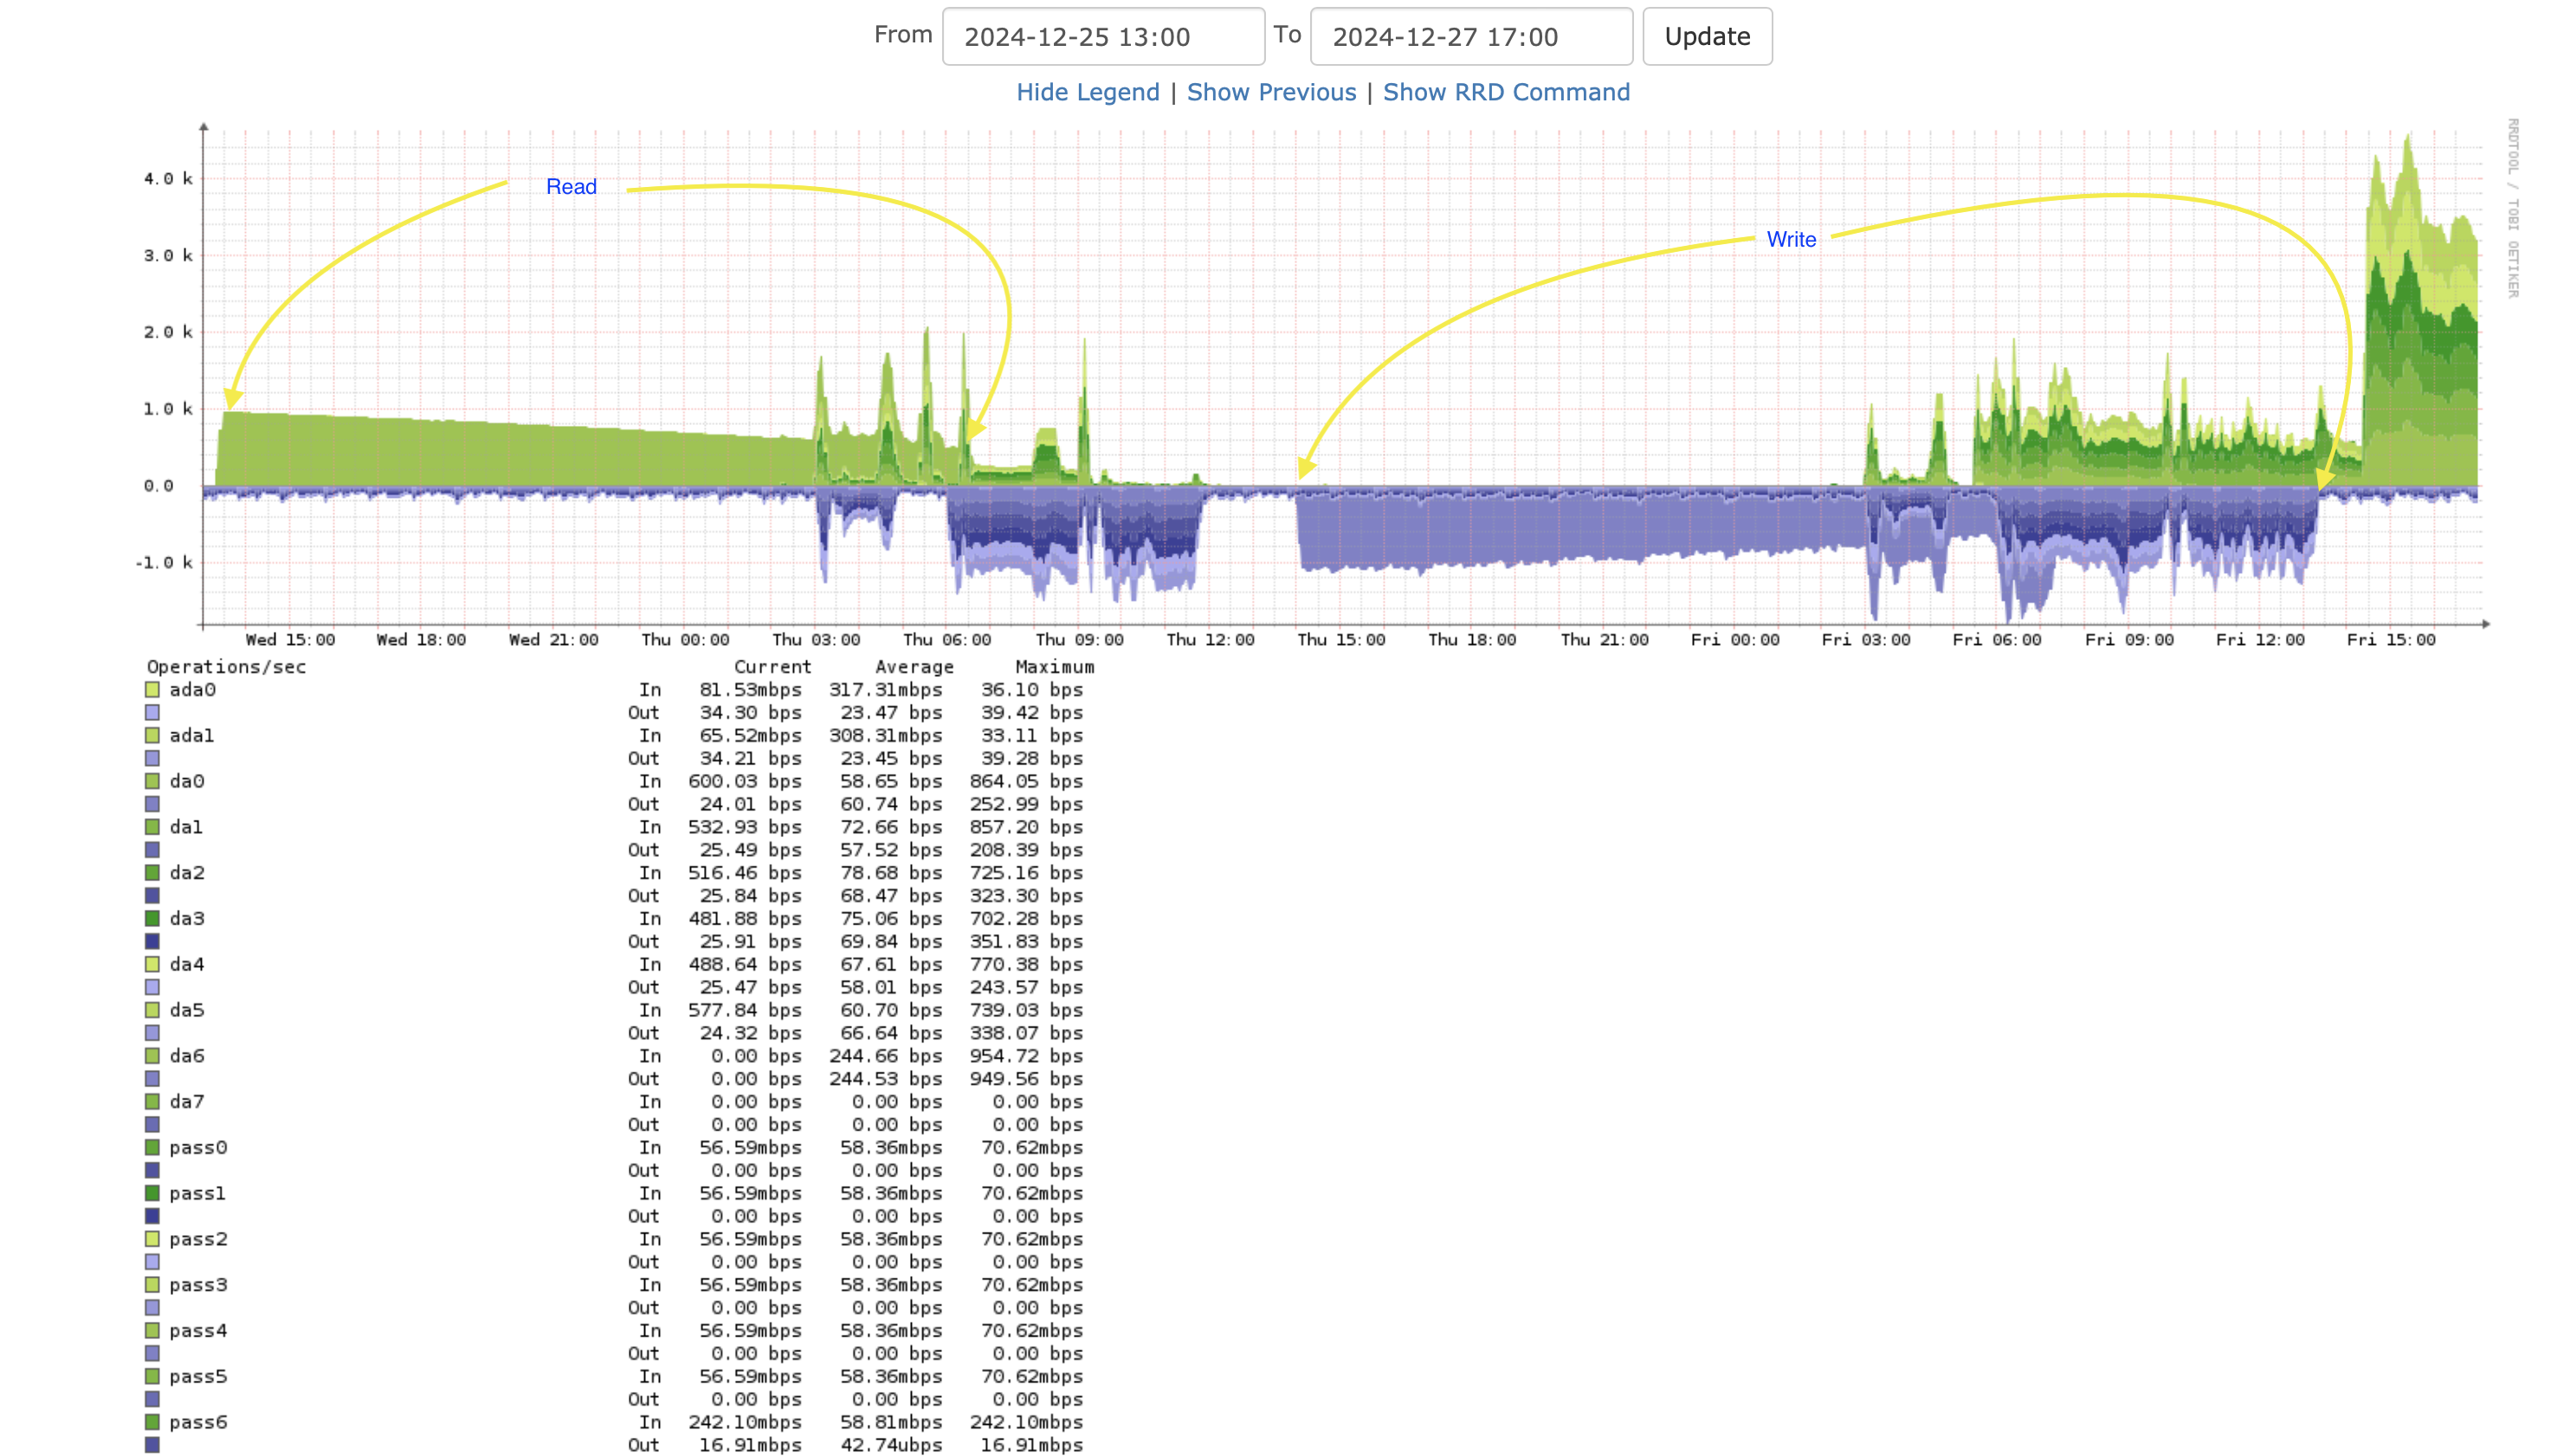
The graphs
This is an annotated screen shot of the LibreNMS graph of this host. You can see the read/write operations via dd.
Let’s try a write
I just started this:
[13:59 r730-03 dvl ~] % sudo dd of=/dev/da6 if=/dev/zero bs=1M
16:44
I’m back at the laptop:
[13:59 r730-03 dvl ~] % sudo dd of=/dev/da6 if=/dev/zero bs=1M
load: 0.51  cmd: dd 12575 [physwr] 12950.92r 5.40u 471.21s 3% 3432k
2976310+0 records in
2976310+0 records out
3120887234560 bytes transferred in 12950.920663 secs (240978021 bytes/sec)
load: 0.53  cmd: dd 12575 [physwr] 21612.61r 8.48u 762.17s 2% 3432k
4824091+0 records in
4824091+0 records out
5058426044416 bytes transferred in 21612.616707 secs (234049681 bytes/sec)
load: 0.24  cmd: dd 12575 [physwr] 25010.75r 9.66u 872.34s 2% 3432k
5512979+0 records in
5512979+0 records out
5780777467904 bytes transferred in 25010.762233 secs (231131599 bytes/sec)
dd: /dev/da6: end of device
11444225+0 records in
11444224+0 records out
12000138625024 bytes transferred in 62049.664409 secs (193395706 bytes/sec)
[16:44 r730-03 dvl ~] %
Hmm, I see that only just finished and took about 26 hours and 45 minutes.
Let’s check the logs:
Dec 27 05:52:17 r730-03 smartd[15472]: Device: /dev/da6 [SAT], 30 Currently unreadable (pending) sectors
Dec 27 05:52:17 r730-03 smartd[15472]: Device: /dev/da6 [SAT], 18 Offline uncorrectable sectors
Dec 27 06:22:18 r730-03 smartd[15472]: Device: /dev/da6 [SAT], 30 Currently unreadable (pending) sectors
Dec 27 06:22:18 r730-03 smartd[15472]: Device: /dev/da6 [SAT], 18 Offline uncorrectable sectors
Dec 27 06:52:17 r730-03 smartd[15472]: Device: /dev/da6 [SAT], 30 Currently unreadable (pending) sectors
Dec 27 06:52:17 r730-03 smartd[15472]: Device: /dev/da6 [SAT], 18 Offline uncorrectable sectors
Dec 27 07:22:17 r730-03 syslogd: last message repeated 1 times
Dec 27 07:52:18 r730-03 syslogd: last message repeated 1 times
Dec 27 08:22:17 r730-03 smartd[15472]: Device: /dev/da6 [SAT], 18 Offline uncorrectable sectors
Dec 27 08:52:17 r730-03 syslogd: last message repeated 1 times
Dec 27 09:22:17 r730-03 syslogd: last message repeated 1 times
Dec 27 09:52:19 r730-03 syslogd: last message repeated 1 times
Dec 27 10:22:18 r730-03 syslogd: last message repeated 1 times
Dec 27 10:52:19 r730-03 syslogd: last message repeated 1 times
See how theCurrently unreadable (pending) sectors messages have stopped. I think they stopped when the dd wrote to those sectors.
The uncorrectable sectors message remains.
smart tests
This is the device current status:
[16:54 r730-03 dvl ~] % sudo smartctl -a /dev/da6
smartctl 7.4 2023-08-01 r5530 [FreeBSD 14.1-RELEASE-p5 amd64] (local build)
Copyright (C) 2002-23, Bruce Allen, Christian Franke, www.smartmontools.org

=== START OF INFORMATION SECTION ===
Model Family:     HGST Ultrastar DC HC520 (He12)
Device Model:     HGST HUH721212ALN604
Serial Number:    8CJR6GZE
LU WWN Device Id: 5 000cca 26fe64782
Firmware Version: LEGNW9U0
User Capacity:    12,000,138,625,024 bytes [12.0 TB]
Sector Size:      4096 bytes logical/physical
Rotation Rate:    7200 rpm
Form Factor:      3.5 inches
Device is:        In smartctl database 7.3/5528
ATA Version is:   ACS-2, ATA8-ACS T13/1699-D revision 4
SATA Version is:  SATA 3.2, 6.0 Gb/s (current: 6.0 Gb/s)
Local Time is:    Fri Dec 27 16:55:11 2024 UTC
SMART support is: Available - device has SMART capability.
SMART support is: Enabled

=== START OF READ SMART DATA SECTION ===
SMART overall-health self-assessment test result: PASSED

General SMART Values:
Offline data collection status:  (0x82)	Offline data collection activity
					was completed without error.
					Auto Offline Data Collection: Enabled.
Self-test execution status:      (   0)	The previous self-test routine completed
					without error or no self-test has ever
					been run.
Total time to complete Offline
data collection: 		(   87) seconds.
Offline data collection
capabilities: 			 (0x5b) SMART execute Offline immediate.
					Auto Offline data collection on/off support.
					Suspend Offline collection upon new
					command.
					Offline surface scan supported.
					Self-test supported.
					No Conveyance Self-test supported.
					Selective Self-test supported.
SMART capabilities:            (0x0003)	Saves SMART data before entering
					power-saving mode.
					Supports SMART auto save timer.
Error logging capability:        (0x01)	Error logging supported.
					General Purpose Logging supported.
Short self-test routine
recommended polling time: 	 (   2) minutes.
Extended self-test routine
recommended polling time: 	 (1285) minutes.
SCT capabilities: 	       (0x003d)	SCT Status supported.
					SCT Error Recovery Control supported.
					SCT Feature Control supported.
					SCT Data Table supported.

SMART Attributes Data Structure revision number: 16
Vendor Specific SMART Attributes with Thresholds:
ID# ATTRIBUTE_NAME          FLAG     VALUE WORST THRESH TYPE      UPDATED  WHEN_FAILED RAW_VALUE
  1 Raw_Read_Error_Rate     0x000b   100   100   016    Pre-fail  Always       -       0
  2 Throughput_Performance  0x0005   132   132   054    Pre-fail  Offline      -       96
  3 Spin_Up_Time            0x0007   162   162   024    Pre-fail  Always       -       411 (Average 400)
  4 Start_Stop_Count        0x0012   100   100   000    Old_age   Always       -       14
  5 Reallocated_Sector_Ct   0x0033   100   100   005    Pre-fail  Always       -       348
  7 Seek_Error_Rate         0x000b   100   100   067    Pre-fail  Always       -       0
  8 Seek_Time_Performance   0x0005   128   128   020    Pre-fail  Offline      -       18
  9 Power_On_Hours          0x0012   099   099   000    Old_age   Always       -       8089
 10 Spin_Retry_Count        0x0013   100   100   060    Pre-fail  Always       -       0
 12 Power_Cycle_Count       0x0032   100   100   000    Old_age   Always       -       14
 22 Helium_Level            0x0023   100   100   025    Pre-fail  Always       -       6553700
192 Power-Off_Retract_Count 0x0032   100   100   000    Old_age   Always       -       430
193 Load_Cycle_Count        0x0012   100   100   000    Old_age   Always       -       430
194 Temperature_Celsius     0x0002   230   230   000    Old_age   Always       -       26 (Min/Max 19/40)
196 Reallocated_Event_Count 0x0032   100   100   000    Old_age   Always       -       348
197 Current_Pending_Sector  0x0022   100   100   000    Old_age   Always       -       0
198 Offline_Uncorrectable   0x0008   100   100   000    Old_age   Offline      -       18
199 UDMA_CRC_Error_Count    0x000a   200   200   000    Old_age   Always       -       0

SMART Error Log Version: 1
ATA Error Count: 65 (device log contains only the most recent five errors)
	CR = Command Register [HEX]
	FR = Features Register [HEX]
	SC = Sector Count Register [HEX]
	SN = Sector Number Register [HEX]
	CL = Cylinder Low Register [HEX]
	CH = Cylinder High Register [HEX]
	DH = Device/Head Register [HEX]
	DC = Device Command Register [HEX]
	ER = Error register [HEX]
	ST = Status register [HEX]
Powered_Up_Time is measured from power on, and printed as
DDd+hh:mm:SS.sss where DD=days, hh=hours, mm=minutes,
SS=sec, and sss=millisec. It "wraps" after 49.710 days.

Error 65 occurred at disk power-on lifetime: 8055 hours (335 days + 15 hours)
  When the command that caused the error occurred, the device was doing SMART Offline or Self-test.

  After command completion occurred, registers were:
  ER ST SC SN CL CH DH
  -- -- -- -- -- -- --
  40 41 00 00 00 00 00  Error: UNC at LBA = 0x00000000 = 0

  Commands leading to the command that caused the error were:
  CR FR SC SN CL CH DH DC   Powered_Up_Time  Command/Feature_Name
  -- -- -- -- -- -- -- --  ----------------  --------------------
  60 31 00 cf ff 9f 40 00   3d+09:16:23.225  READ FPDMA QUEUED
  2f 00 01 10 00 00 00 00   3d+09:16:20.192  READ LOG EXT
  2f 00 01 10 00 00 00 00   3d+09:16:20.192  READ LOG EXT
  60 45 00 00 ff 9f 40 00   3d+09:16:17.456  READ FPDMA QUEUED
  60 45 00 45 ff 9f 40 00   3d+09:16:17.306  READ FPDMA QUEUED

Error 64 occurred at disk power-on lifetime: 8055 hours (335 days + 15 hours)
  When the command that caused the error occurred, the device was doing SMART Offline or Self-test.

  After command completion occurred, registers were:
  ER ST SC SN CL CH DH
  -- -- -- -- -- -- --
  40 41 00 00 00 00 00  Error: UNC at LBA = 0x00000000 = 0

  Commands leading to the command that caused the error were:
  CR FR SC SN CL CH DH DC   Powered_Up_Time  Command/Feature_Name
  -- -- -- -- -- -- -- --  ----------------  --------------------
  60 45 00 00 ff 9f 40 00   3d+09:16:20.192  READ FPDMA QUEUED
  60 45 00 45 ff 9f 40 00   3d+09:16:17.306  READ FPDMA QUEUED
  2f 00 01 10 00 00 00 00   3d+09:16:17.300  READ LOG EXT
  2f 00 01 10 00 00 00 00   3d+09:16:17.300  READ LOG EXT
  60 31 18 cf ff 9f 40 00   3d+09:16:14.551  READ FPDMA QUEUED

Error 63 occurred at disk power-on lifetime: 8055 hours (335 days + 15 hours)
  When the command that caused the error occurred, the device was doing SMART Offline or Self-test.

  After command completion occurred, registers were:
  ER ST SC SN CL CH DH
  -- -- -- -- -- -- --
  40 41 00 00 00 00 00  Error: UNC at LBA = 0x00000000 = 0

  Commands leading to the command that caused the error were:
  CR FR SC SN CL CH DH DC   Powered_Up_Time  Command/Feature_Name
  -- -- -- -- -- -- -- --  ----------------  --------------------
  60 45 00 00 ff 9f 40 00   3d+09:16:17.300  READ FPDMA QUEUED
  60 31 18 cf ff 9f 40 00   3d+09:16:14.551  READ FPDMA QUEUED
  60 45 10 8a ff 9f 40 00   3d+09:16:14.551  READ FPDMA QUEUED
  60 45 08 45 ff 9f 40 00   3d+09:16:14.551  READ FPDMA QUEUED
  2f 00 01 10 00 00 00 00   3d+09:16:14.550  READ LOG EXT

Error 62 occurred at disk power-on lifetime: 8055 hours (335 days + 15 hours)
  When the command that caused the error occurred, the device was doing SMART Offline or Self-test.

  After command completion occurred, registers were:
  ER ST SC SN CL CH DH
  -- -- -- -- -- -- --
  40 41 00 00 00 00 00  Error: UNC at LBA = 0x00000000 = 0

  Commands leading to the command that caused the error were:
  CR FR SC SN CL CH DH DC   Powered_Up_Time  Command/Feature_Name
  -- -- -- -- -- -- -- --  ----------------  --------------------
  60 45 18 00 fe 9f 40 00   3d+09:16:14.550  READ FPDMA QUEUED
  60 31 10 cf fe 9f 40 00   3d+09:16:11.738  READ FPDMA QUEUED
  60 45 08 8a fe 9f 40 00   3d+09:16:11.738  READ FPDMA QUEUED
  60 45 00 45 fe 9f 40 00   3d+09:16:11.738  READ FPDMA QUEUED
  2f 00 01 10 00 00 00 00   3d+09:16:11.733  READ LOG EXT

Error 61 occurred at disk power-on lifetime: 8055 hours (335 days + 15 hours)
  When the command that caused the error occurred, the device was doing SMART Offline or Self-test.

  After command completion occurred, registers were:
  ER ST SC SN CL CH DH
  -- -- -- -- -- -- --
  40 41 00 00 00 00 00  Error: UNC at LBA = 0x00000000 = 0

  Commands leading to the command that caused the error were:
  CR FR SC SN CL CH DH DC   Powered_Up_Time  Command/Feature_Name
  -- -- -- -- -- -- -- --  ----------------  --------------------
  60 45 00 00 fe 9f 40 00   3d+09:16:11.733  READ FPDMA QUEUED
  60 31 18 cf fd 9f 40 00   3d+09:16:08.967  READ FPDMA QUEUED
  60 45 10 8a fd 9f 40 00   3d+09:16:08.967  READ FPDMA QUEUED
  60 45 08 45 fd 9f 40 00   3d+09:16:08.967  READ FPDMA QUEUED
  60 45 00 00 fd 9f 40 00   3d+09:16:08.967  READ FPDMA QUEUED

SMART Self-test log structure revision number 1
Num  Test_Description    Status                  Remaining  LifeTime(hours)  LBA_of_first_error
# 1  Short offline       Completed: read failure       90%      7259         2929713821
# 2  Short offline       Completed: read failure       20%      7232         2929713821
# 3  Short offline       Completed: read failure       30%      7229         2929713821
# 4  Short offline       Completed without error       00%       183         -
# 5  Extended offline    Completed without error       00%        20         -
# 6  Short offline       Completed without error       00%         0         -

SMART Selective self-test log data structure revision number 1
 SPAN  MIN_LBA  MAX_LBA  CURRENT_TEST_STATUS
    1        0        0  Not_testing
    2        0        0  Not_testing
    3        0        0  Not_testing
    4        0        0  Not_testing
    5        0        0  Not_testing
Selective self-test flags (0x0):
  After scanning selected spans, do NOT read-scan remainder of disk.
If Selective self-test is pending on power-up, resume after 0 minute delay.

The above only provides legacy SMART information - try 'smartctl -x' for more
And more information:
[16:55 r730-03 dvl ~] % sudo smartctl -x /dev/da6
smartctl 7.4 2023-08-01 r5530 [FreeBSD 14.1-RELEASE-p5 amd64] (local build)
Copyright (C) 2002-23, Bruce Allen, Christian Franke, www.smartmontools.org

=== START OF INFORMATION SECTION ===
Model Family:     HGST Ultrastar DC HC520 (He12)
Device Model:     HGST HUH721212ALN604
Serial Number:    8CJR6GZE
LU WWN Device Id: 5 000cca 26fe64782
Firmware Version: LEGNW9U0
User Capacity:    12,000,138,625,024 bytes [12.0 TB]
Sector Size:      4096 bytes logical/physical
Rotation Rate:    7200 rpm
Form Factor:      3.5 inches
Device is:        In smartctl database 7.3/5528
ATA Version is:   ACS-2, ATA8-ACS T13/1699-D revision 4
SATA Version is:  SATA 3.2, 6.0 Gb/s (current: 6.0 Gb/s)
Local Time is:    Fri Dec 27 16:56:07 2024 UTC
SMART support is: Available - device has SMART capability.
SMART support is: Enabled
AAM feature is:   Unavailable
APM feature is:   Disabled
Rd look-ahead is: Enabled
Write cache is:   Disabled
DSN feature is:   Unavailable
ATA Security is:  Disabled, NOT FROZEN [SEC1]
Wt Cache Reorder: Enabled

=== START OF READ SMART DATA SECTION ===
SMART overall-health self-assessment test result: PASSED

General SMART Values:
Offline data collection status:  (0x82)	Offline data collection activity
					was completed without error.
					Auto Offline Data Collection: Enabled.
Self-test execution status:      (   0)	The previous self-test routine completed
					without error or no self-test has ever
					been run.
Total time to complete Offline
data collection: 		(   87) seconds.
Offline data collection
capabilities: 			 (0x5b) SMART execute Offline immediate.
					Auto Offline data collection on/off support.
					Suspend Offline collection upon new
					command.
					Offline surface scan supported.
					Self-test supported.
					No Conveyance Self-test supported.
					Selective Self-test supported.
SMART capabilities:            (0x0003)	Saves SMART data before entering
					power-saving mode.
					Supports SMART auto save timer.
Error logging capability:        (0x01)	Error logging supported.
					General Purpose Logging supported.
Short self-test routine
recommended polling time: 	 (   2) minutes.
Extended self-test routine
recommended polling time: 	 (1285) minutes.
SCT capabilities: 	       (0x003d)	SCT Status supported.
					SCT Error Recovery Control supported.
					SCT Feature Control supported.
					SCT Data Table supported.

SMART Attributes Data Structure revision number: 16
Vendor Specific SMART Attributes with Thresholds:
ID# ATTRIBUTE_NAME          FLAGS    VALUE WORST THRESH FAIL RAW_VALUE
  1 Raw_Read_Error_Rate     PO-R--   100   100   016    -    0
  2 Throughput_Performance  P-S---   132   132   054    -    96
  3 Spin_Up_Time            POS---   162   162   024    -    411 (Average 400)
  4 Start_Stop_Count        -O--C-   100   100   000    -    14
  5 Reallocated_Sector_Ct   PO--CK   100   100   005    -    348
  7 Seek_Error_Rate         PO-R--   100   100   067    -    0
  8 Seek_Time_Performance   P-S---   128   128   020    -    18
  9 Power_On_Hours          -O--C-   099   099   000    -    8089
 10 Spin_Retry_Count        PO--C-   100   100   060    -    0
 12 Power_Cycle_Count       -O--CK   100   100   000    -    14
 22 Helium_Level            PO---K   100   100   025    -    6553700
192 Power-Off_Retract_Count -O--CK   100   100   000    -    430
193 Load_Cycle_Count        -O--C-   100   100   000    -    430
194 Temperature_Celsius     -O----   240   240   000    -    25 (Min/Max 19/40)
196 Reallocated_Event_Count -O--CK   100   100   000    -    348
197 Current_Pending_Sector  -O---K   100   100   000    -    0
198 Offline_Uncorrectable   ---R--   100   100   000    -    18
199 UDMA_CRC_Error_Count    -O-R--   200   200   000    -    0
                            ||||||_ K auto-keep
                            |||||__ C event count
                            ||||___ R error rate
                            |||____ S speed/performance
                            ||_____ O updated online
                            |______ P prefailure warning

General Purpose Log Directory Version 1
SMART           Log Directory Version 1 [multi-sector log support]
Address    Access  R/W   Size  Description
0x00       GPL,SL  R/O      1  Log Directory
0x01           SL  R/O      1  Summary SMART error log
0x02           SL  R/O      1  Comprehensive SMART error log
0x03       GPL     R/O      1  Ext. Comprehensive SMART error log
0x04       GPL     R/O    256  Device Statistics log
0x04       SL      R/O    255  Device Statistics log
0x06           SL  R/O      1  SMART self-test log
0x07       GPL     R/O      1  Extended self-test log
0x08       GPL     R/O      2  Power Conditions log
0x09           SL  R/W      1  Selective self-test log
0x0c       GPL     R/O    688  Pending Defects log
0x10       GPL     R/O      1  NCQ Command Error log
0x11       GPL     R/O      1  SATA Phy Event Counters log
0x12       GPL     R/O      1  SATA NCQ Non-Data log
0x13       GPL     R/O      1  SATA NCQ Send and Receive log
0x15       GPL     R/W      1  Rebuild Assist log
0x21       GPL     R/O      1  Write stream error log
0x22       GPL     R/O      1  Read stream error log
0x24       GPL     R/O    256  Current Device Internal Status Data log
0x25       GPL     R/O    256  Saved Device Internal Status Data log
0x30       GPL,SL  R/O      9  IDENTIFY DEVICE data log
0x80-0x9f  GPL,SL  R/W     16  Host vendor specific log
0xe0       GPL,SL  R/W      1  SCT Command/Status
0xe1       GPL,SL  R/W      1  SCT Data Transfer

SMART Extended Comprehensive Error Log Version: 1 (1 sectors)
Device Error Count: 65 (device log contains only the most recent 4 errors)
	CR     = Command Register
	FEATR  = Features Register
	COUNT  = Count (was: Sector Count) Register
	LBA_48 = Upper bytes of LBA High/Mid/Low Registers ]  ATA-8
	LH     = LBA High (was: Cylinder High) Register    ]   LBA
	LM     = LBA Mid (was: Cylinder Low) Register      ] Register
	LL     = LBA Low (was: Sector Number) Register     ]
	DV     = Device (was: Device/Head) Register
	DC     = Device Control Register
	ER     = Error register
	ST     = Status register
Powered_Up_Time is measured from power on, and printed as
DDd+hh:mm:SS.sss where DD=days, hh=hours, mm=minutes,
SS=sec, and sss=millisec. It "wraps" after 49.710 days.

Error 65 [0] occurred at disk power-on lifetime: 8055 hours (335 days + 15 hours)
  When the command that caused the error occurred, the device was doing SMART Offline or Self-test.

  After command completion occurred, registers were:
  ER -- ST COUNT  LBA_48  LH LM LL DV DC
  -- -- -- == -- == == == -- -- -- -- --
  40 -- 41 00 00 00 00 00 00 00 00 00 00  Error: UNC at LBA = 0x00000000 = 0

  Commands leading to the command that caused the error were:
  CR FEATR COUNT  LBA_48  LH LM LL DV DC  Powered_Up_Time  Command/Feature_Name
  -- == -- == -- == == == -- -- -- -- --  ---------------  --------------------
  60 00 31 00 00 00 00 ae 9f ff cf 40 00  3d+09:16:23.225  READ FPDMA QUEUED
  2f 00 00 00 01 00 00 00 00 00 10 00 00  3d+09:16:20.192  READ LOG EXT
  2f 00 00 00 01 00 00 00 00 00 10 00 00  3d+09:16:20.192  READ LOG EXT
  60 00 45 00 00 00 00 ae 9f ff 00 40 00  3d+09:16:17.456  READ FPDMA QUEUED
  60 00 45 00 00 00 00 ae 9f ff 45 40 00  3d+09:16:17.306  READ FPDMA QUEUED

Error 64 [3] occurred at disk power-on lifetime: 8055 hours (335 days + 15 hours)
  When the command that caused the error occurred, the device was doing SMART Offline or Self-test.

  After command completion occurred, registers were:
  ER -- ST COUNT  LBA_48  LH LM LL DV DC
  -- -- -- == -- == == == -- -- -- -- --
  40 -- 41 00 00 00 00 00 00 00 00 00 00  Error: UNC at LBA = 0x00000000 = 0

  Commands leading to the command that caused the error were:
  CR FEATR COUNT  LBA_48  LH LM LL DV DC  Powered_Up_Time  Command/Feature_Name
  -- == -- == -- == == == -- -- -- -- --  ---------------  --------------------
  60 00 45 00 00 00 00 ae 9f ff 00 40 00  3d+09:16:20.192  READ FPDMA QUEUED
  60 00 45 00 00 00 00 ae 9f ff 45 40 00  3d+09:16:17.306  READ FPDMA QUEUED
  2f 00 00 00 01 00 00 00 00 00 10 00 00  3d+09:16:17.300  READ LOG EXT
  2f 00 00 00 01 00 00 00 00 00 10 00 00  3d+09:16:17.300  READ LOG EXT
  60 00 31 00 18 00 00 ae 9f ff cf 40 00  3d+09:16:14.551  READ FPDMA QUEUED

Error 63 [2] occurred at disk power-on lifetime: 8055 hours (335 days + 15 hours)
  When the command that caused the error occurred, the device was doing SMART Offline or Self-test.

  After command completion occurred, registers were:
  ER -- ST COUNT  LBA_48  LH LM LL DV DC
  -- -- -- == -- == == == -- -- -- -- --
  40 -- 41 00 00 00 00 00 00 00 00 00 00  Error: UNC at LBA = 0x00000000 = 0

  Commands leading to the command that caused the error were:
  CR FEATR COUNT  LBA_48  LH LM LL DV DC  Powered_Up_Time  Command/Feature_Name
  -- == -- == -- == == == -- -- -- -- --  ---------------  --------------------
  60 00 45 00 00 00 00 ae 9f ff 00 40 00  3d+09:16:17.300  READ FPDMA QUEUED
  60 00 31 00 18 00 00 ae 9f ff cf 40 00  3d+09:16:14.551  READ FPDMA QUEUED
  60 00 45 00 10 00 00 ae 9f ff 8a 40 00  3d+09:16:14.551  READ FPDMA QUEUED
  60 00 45 00 08 00 00 ae 9f ff 45 40 00  3d+09:16:14.551  READ FPDMA QUEUED
  2f 00 00 00 01 00 00 00 00 00 10 00 00  3d+09:16:14.550  READ LOG EXT

Error 62 [1] occurred at disk power-on lifetime: 8055 hours (335 days + 15 hours)
  When the command that caused the error occurred, the device was doing SMART Offline or Self-test.

  After command completion occurred, registers were:
  ER -- ST COUNT  LBA_48  LH LM LL DV DC
  -- -- -- == -- == == == -- -- -- -- --
  40 -- 41 00 00 00 00 00 00 00 00 00 00  Error: UNC at LBA = 0x00000000 = 0

  Commands leading to the command that caused the error were:
  CR FEATR COUNT  LBA_48  LH LM LL DV DC  Powered_Up_Time  Command/Feature_Name
  -- == -- == -- == == == -- -- -- -- --  ---------------  --------------------
  60 00 45 00 18 00 00 ae 9f fe 00 40 00  3d+09:16:14.550  READ FPDMA QUEUED
  60 00 31 00 10 00 00 ae 9f fe cf 40 00  3d+09:16:11.738  READ FPDMA QUEUED
  60 00 45 00 08 00 00 ae 9f fe 8a 40 00  3d+09:16:11.738  READ FPDMA QUEUED
  60 00 45 00 00 00 00 ae 9f fe 45 40 00  3d+09:16:11.738  READ FPDMA QUEUED
  2f 00 00 00 01 00 00 00 00 00 10 00 00  3d+09:16:11.733  READ LOG EXT

SMART Extended Self-test Log Version: 1 (1 sectors)
Num  Test_Description    Status                  Remaining  LifeTime(hours)  LBA_of_first_error
# 1  Short offline       Completed: read failure       90%      7259         2929713821
# 2  Short offline       Completed: read failure       20%      7232         2929713821
# 3  Short offline       Completed: read failure       30%      7229         2929713821
# 4  Short offline       Completed without error       00%       183         -
# 5  Extended offline    Completed without error       00%        20         -
# 6  Short offline       Completed without error       00%         0         -

SMART Selective self-test log data structure revision number 1
 SPAN  MIN_LBA  MAX_LBA  CURRENT_TEST_STATUS
    1        0        0  Not_testing
    2        0        0  Not_testing
    3        0        0  Not_testing
    4        0        0  Not_testing
    5        0        0  Not_testing
Selective self-test flags (0x0):
  After scanning selected spans, do NOT read-scan remainder of disk.
If Selective self-test is pending on power-up, resume after 0 minute delay.

SCT Status Version:                  3
SCT Version (vendor specific):       256 (0x0100)
Device State:                        Active (0)
Current Temperature:                    25 Celsius
Power Cycle Min/Max Temperature:     23/28 Celsius
Lifetime    Min/Max Temperature:     19/40 Celsius
Under/Over Temperature Limit Count:   0/0

SCT Temperature History Version:     2
Temperature Sampling Period:         1 minute
Temperature Logging Interval:        1 minute
Min/Max recommended Temperature:      0/60 Celsius
Min/Max Temperature Limit:           -40/70 Celsius
Temperature History Size (Index):    128 (1)

Index    Estimated Time   Temperature Celsius
   2    2024-12-27 14:49    25  ******
   3    2024-12-27 14:50    26  *******
 ...    ..( 11 skipped).    ..  *******
  15    2024-12-27 15:02    26  *******
  16    2024-12-27 15:03    25  ******
  17    2024-12-27 15:04    25  ******
  18    2024-12-27 15:05    26  *******
 ...    ..( 12 skipped).    ..  *******
  31    2024-12-27 15:18    26  *******
  32    2024-12-27 15:19    25  ******
  33    2024-12-27 15:20    25  ******
  34    2024-12-27 15:21    26  *******
 ...    ..( 44 skipped).    ..  *******
  79    2024-12-27 16:06    26  *******
  80    2024-12-27 16:07    25  ******
  81    2024-12-27 16:08    26  *******
 ...    ..( 46 skipped).    ..  *******
   0    2024-12-27 16:55    26  *******
   1    2024-12-27 16:56    25  ******

SCT Error Recovery Control:
           Read: Disabled
          Write: Disabled

Device Statistics (GP Log 0x04)
Page  Offset Size        Value Flags Description
0x01  =====  =               =  ===  == General Statistics (rev 1) ==
0x01  0x008  4              14  ---  Lifetime Power-On Resets
0x01  0x010  4            8089  ---  Power-on Hours
0x01  0x018  6     57399507914  ---  Logical Sectors Written
0x01  0x020  6      1797230238  ---  Number of Write Commands
0x01  0x028  6     97381993303  ---  Logical Sectors Read
0x01  0x030  6      1990435263  ---  Number of Read Commands
0x01  0x038  6     29122344150  ---  Date and Time TimeStamp
0x03  =====  =               =  ===  == Rotating Media Statistics (rev 1) ==
0x03  0x008  4            8084  ---  Spindle Motor Power-on Hours
0x03  0x010  4            8084  ---  Head Flying Hours
0x03  0x018  4             430  ---  Head Load Events
0x03  0x020  4             348  ---  Number of Reallocated Logical Sectors
0x03  0x028  4              96  ---  Read Recovery Attempts
0x03  0x030  4               0  ---  Number of Mechanical Start Failures
0x04  =====  =               =  ===  == General Errors Statistics (rev 1) ==
0x04  0x008  4              65  ---  Number of Reported Uncorrectable Errors
0x04  0x010  4               1  ---  Resets Between Cmd Acceptance and Completion
0x05  =====  =               =  ===  == Temperature Statistics (rev 1) ==
0x05  0x008  1              25  ---  Current Temperature
0x05  0x010  1              25  N--  Average Short Term Temperature
0x05  0x018  1              26  N--  Average Long Term Temperature
0x05  0x020  1              40  ---  Highest Temperature
0x05  0x028  1              19  ---  Lowest Temperature
0x05  0x030  1              39  N--  Highest Average Short Term Temperature
0x05  0x038  1              21  N--  Lowest Average Short Term Temperature
0x05  0x040  1              36  N--  Highest Average Long Term Temperature
0x05  0x048  1              24  N--  Lowest Average Long Term Temperature
0x05  0x050  4               0  ---  Time in Over-Temperature
0x05  0x058  1              60  ---  Specified Maximum Operating Temperature
0x05  0x060  4               0  ---  Time in Under-Temperature
0x05  0x068  1               0  ---  Specified Minimum Operating Temperature
0x06  =====  =               =  ===  == Transport Statistics (rev 1) ==
0x06  0x008  4              43  ---  Number of Hardware Resets
0x06  0x010  4              14  ---  Number of ASR Events
0x06  0x018  4               0  ---  Number of Interface CRC Errors
0xff  =====  =               =  ===  == Vendor Specific Statistics (rev 1) ==
                                |||_ C monitored condition met
                                ||__ D supports DSN
                                |___ N normalized value

Pending Defects log (GP Log 0x0c)
No Defects Logged

SATA Phy Event Counters (GP Log 0x11)
ID      Size     Value  Description
0x0001  2            0  Command failed due to ICRC error
0x0002  2            0  R_ERR response for data FIS
0x0003  2            0  R_ERR response for device-to-host data FIS
0x0004  2            0  R_ERR response for host-to-device data FIS
0x0005  2            0  R_ERR response for non-data FIS
0x0006  2            0  R_ERR response for device-to-host non-data FIS
0x0007  2            0  R_ERR response for host-to-device non-data FIS
0x0008  2            0  Device-to-host non-data FIS retries
0x0009  2            1  Transition from drive PhyRdy to drive PhyNRdy
0x000a  2            2  Device-to-host register FISes sent due to a COMRESET
0x000b  2            0  CRC errors within host-to-device FIS
0x000d  2            0  Non-CRC errors within host-to-device FIS
Let’s run a short test:
[16:56 r730-03 dvl ~] % sudo smartctl -t short /dev/da6
smartctl 7.4 2023-08-01 r5530 [FreeBSD 14.1-RELEASE-p5 amd64] (local build)
Copyright (C) 2002-23, Bruce Allen, Christian Franke, www.smartmontools.org

=== START OF OFFLINE IMMEDIATE AND SELF-TEST SECTION ===
Sending command: "Execute SMART Short self-test routine immediately in off-line mode".
Drive command "Execute SMART Short self-test routine immediately in off-line mode" successful.
Testing has begun.
Please wait 2 minutes for test to complete.
Test will complete after Fri Dec 27 16:59:10 2024 UTC
Use smartctl -X to abort test.
Two minutes later, we see this in the output of sudo smartctl -a /dev/da6:
SMART Self-test log structure revision number 1
Num  Test_Description    Status                  Remaining  LifeTime(hours)  LBA_of_first_error
# 1  Short offline       Completed without error       00%      8089         -
# 2  Short offline       Completed: read failure       90%      7259         2929713821
# 3  Short offline       Completed: read failure       20%      7232         2929713821
# 4  Short offline       Completed: read failure       30%      7229         2929713821
# 5  Short offline       Completed without error       00%       183         -
# 6  Extended offline    Completed without error       00%        20         -
# 7  Short offline       Completed without error       00%         0         -
Notice the three failed short tests. Those were run shortly after the first error messages appeared.
The long test
Next, a long test.
[16:59 r730-03 dvl ~] % sudo smartctl -t long /dev/da6
smartctl 7.4 2023-08-01 r5530 [FreeBSD 14.1-RELEASE-p5 amd64] (local build)
Copyright (C) 2002-23, Bruce Allen, Christian Franke, www.smartmontools.org

=== START OF OFFLINE IMMEDIATE AND SELF-TEST SECTION ===
Sending command: "Execute SMART Extended self-test routine immediately in off-line mode".
Drive command "Execute SMART Extended self-test routine immediately in off-line mode" successful.
Testing has begun.
Please wait 1285 minutes for test to complete.
Test will complete after Sat Dec 28 14:25:00 2024 UTC
Use smartctl -X to abort test.
[17:00 r730-03 dvl ~] %
See you tomorrow.
2024-12-30
After a lost weekend sick in bed, I found:
SMART Self-test log structure revision number 1
Num  Test_Description    Status                  Remaining  LifeTime(hours)  LBA_of_first_error
# 1  Extended offline    Completed without error       00%      8109         -
# 2  Short offline       Completed without error       00%      8089         -
I am going to RMA the drive. And probably order a spare 12TB drive to keep on hand. For the next time.
But wait! There’s more
I always use caution when removing a drive from a running host. I know it is /dev/da6, but that doesn’t necessarily tell me what drive bay.
[19:37 r730-03 dvl ~] % grep da6 /var/run/dmesg.boot da6 at mrsas0 bus 1 scbus1 target 7 lun 0 da6:Fixed Direct Access SPC-4 SCSI device da6: Serial Number 8CJR6GZE da6: 150.000MB/s transfers da6: 11444224MB (2929721344 4096 byte sectors)
This says target 7. That makes me think drive bay 7.
I went into the server console and looked around. I found this:
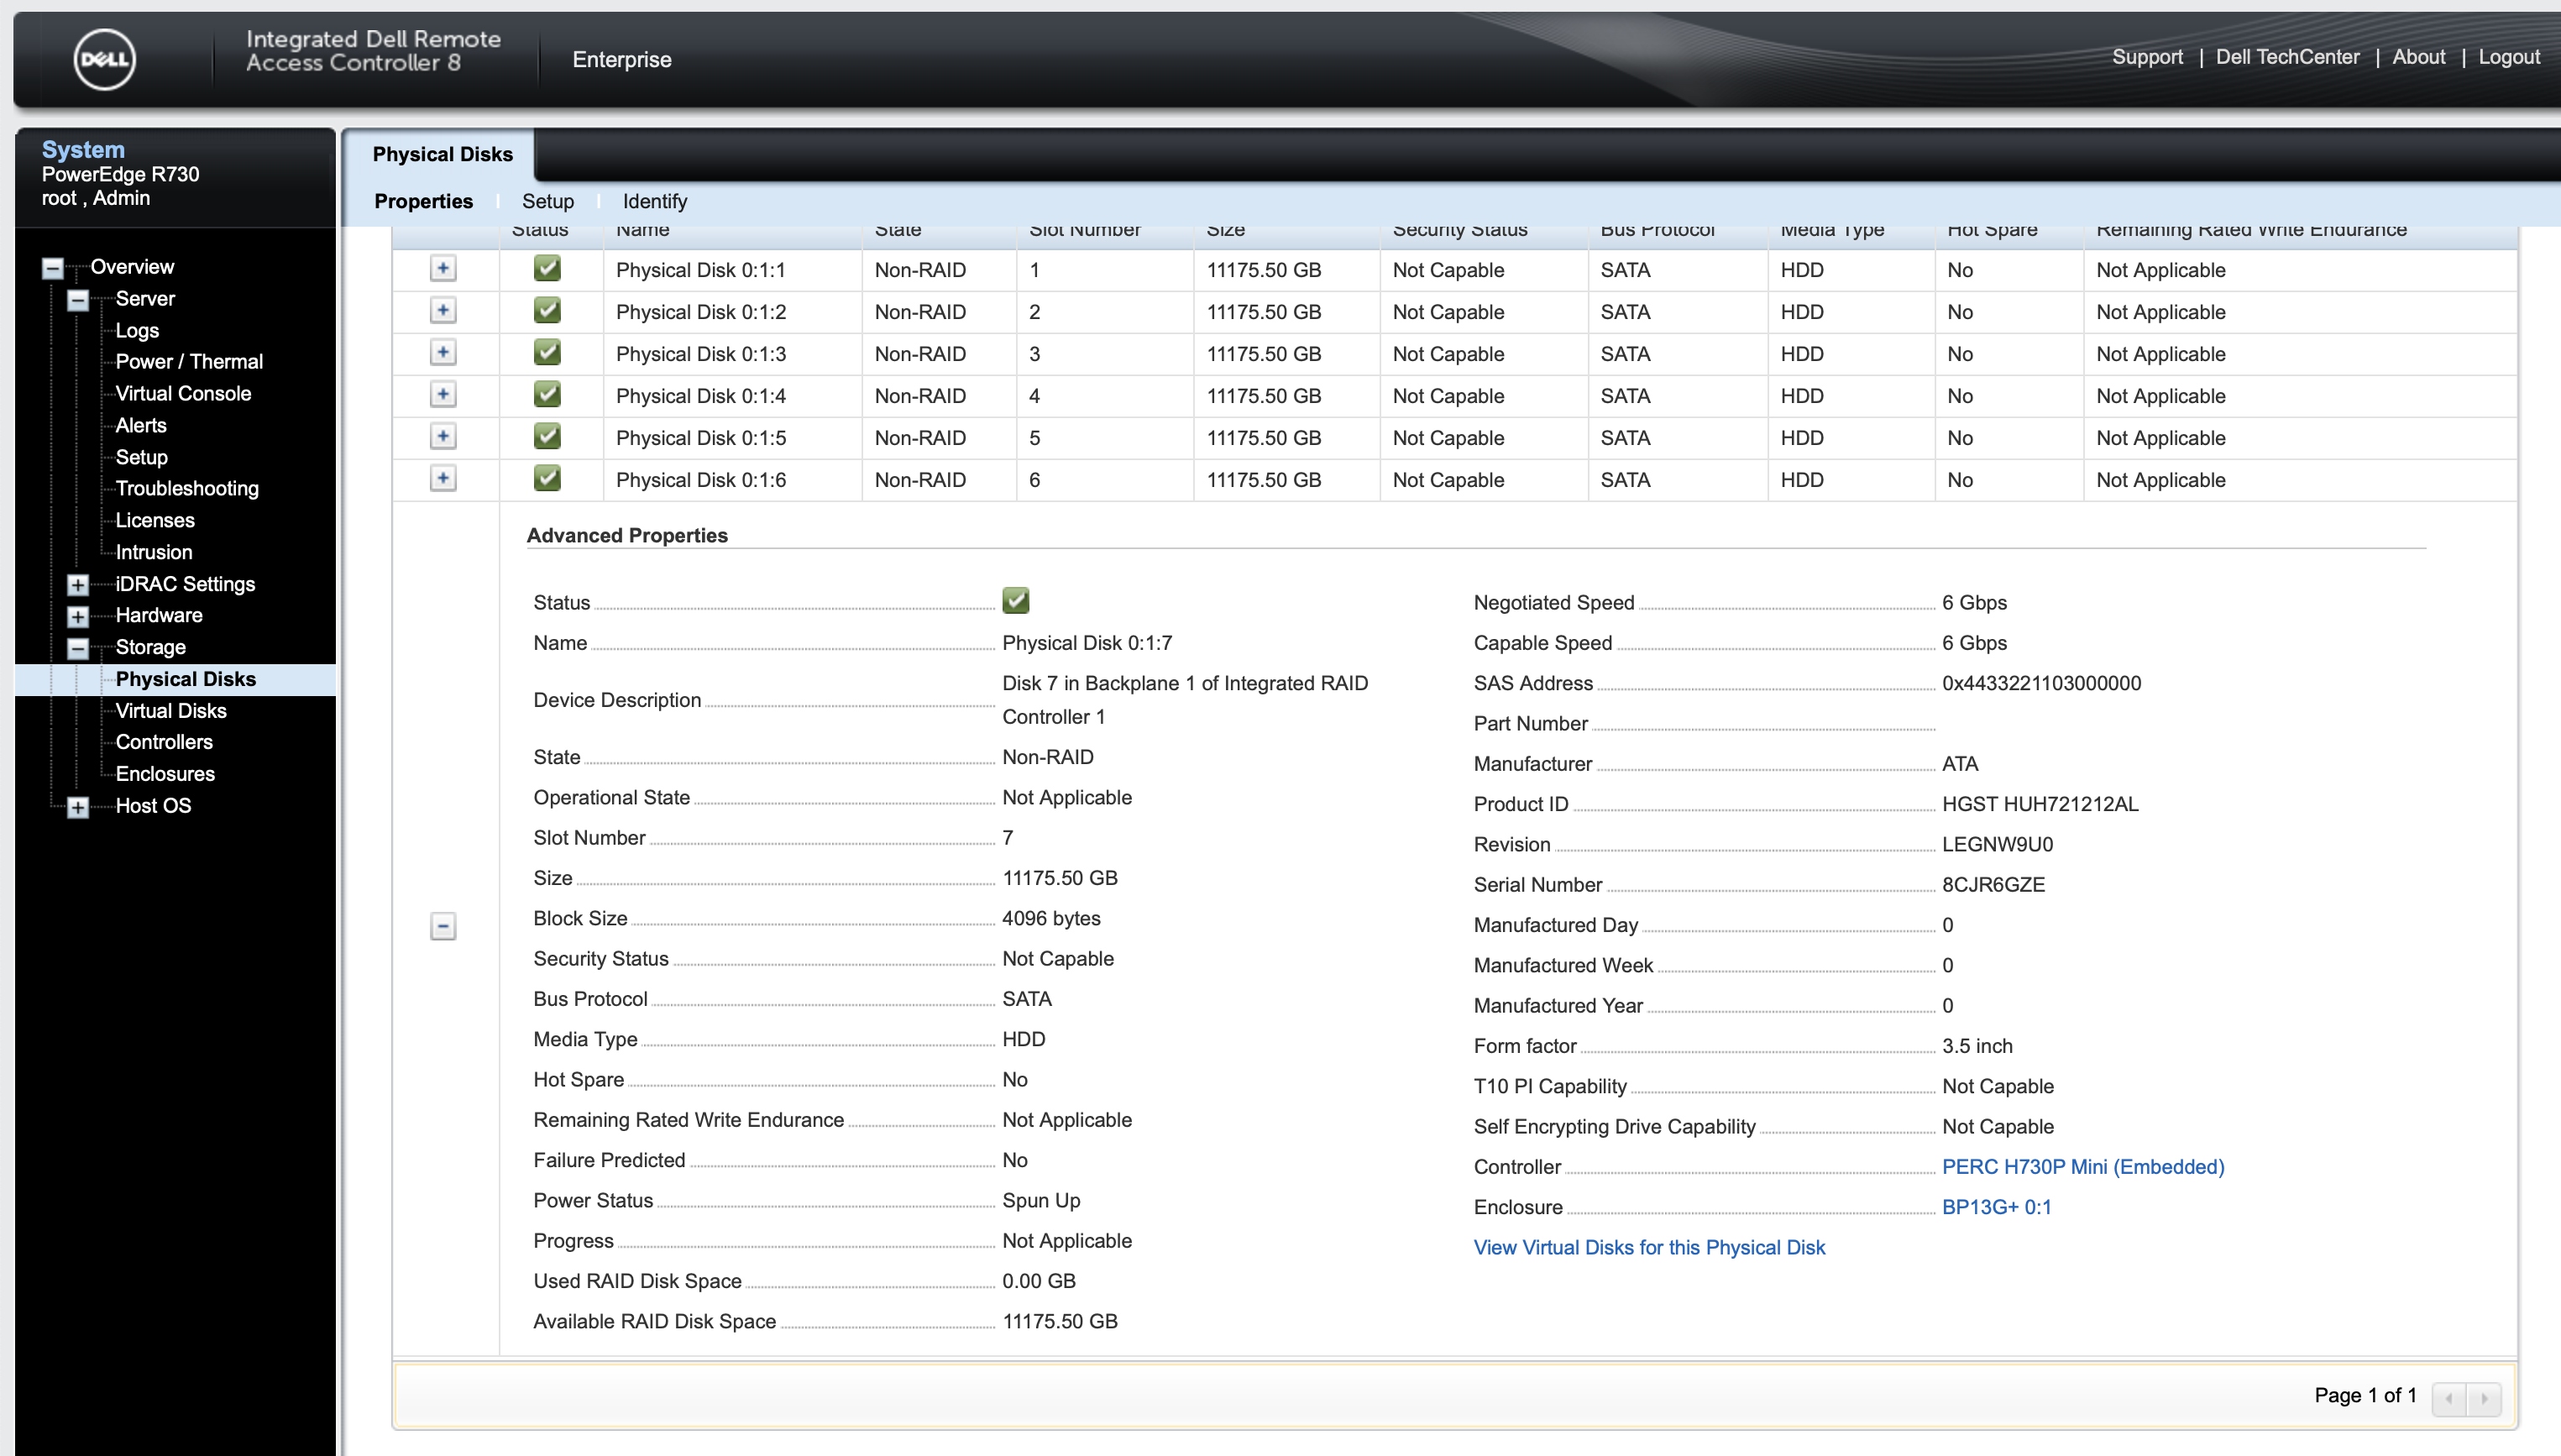
The serial number matches. Drive bay 7.
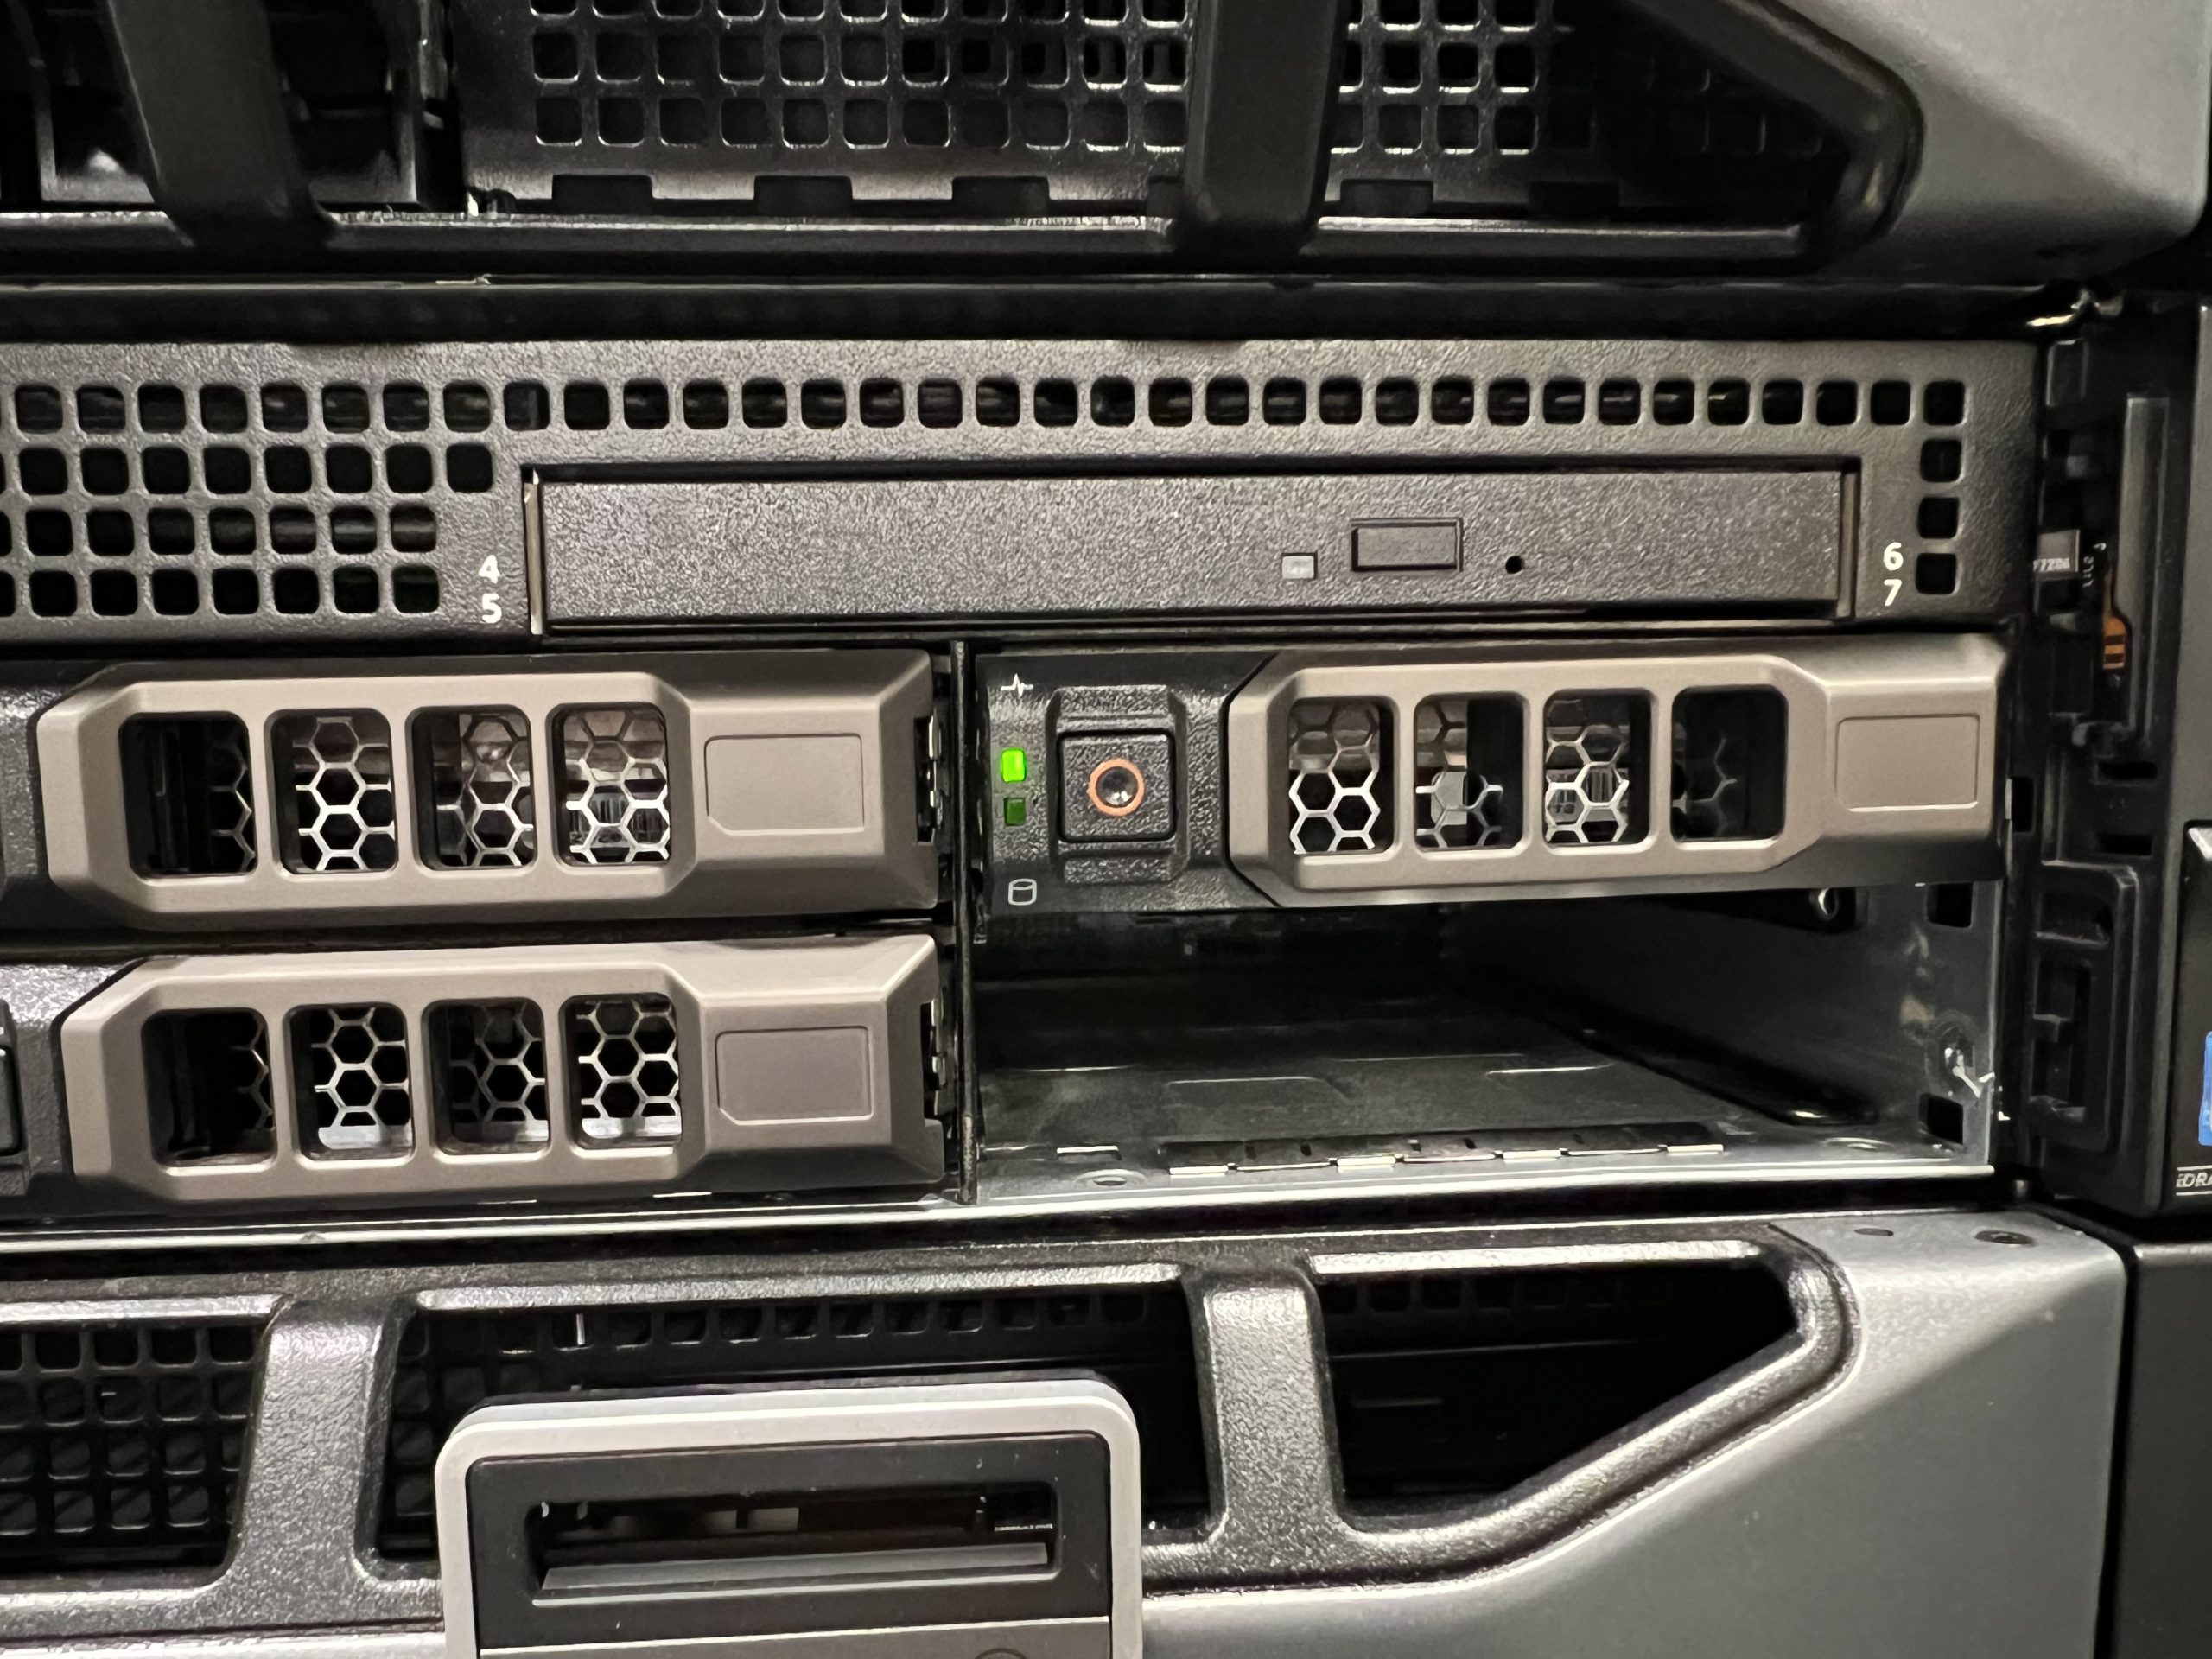
When I got down to the basement, there it is, labelled:
Upon removal, this appeared in /var/log/messages:
Dec 30 19:34:12 r730-03 kernel: mrsas0: System PD deleted target ID: 0x7 Dec 30 19:34:12 r730-03 kernel: da6 at mrsas0 bus 1 scbus1 target 7 lun 0 Dec 30 19:34:12 r730-03 kernel: da6:s/n 8CJR6GZE detached Dec 30 19:34:12 r730-03 kernel: (da6:mrsas0:1:7:0): Periph destroyed
Now it’s time to pack up that drive and send it back.
2025-01-06
A refund has been issued for that RMA. :)


