On 17 October, at 10:17 UTC, the search gate went live on www.freshports.org. A search from a visitor without a login or a search_ok cookie now gets a small challenge page instead of a search. I wrote about the first day in the FreshPorts October speed-up post. This post looks at the twelve days since.
I expected the traffic to drop once the bots got nothing for their trouble. It didn’t. What dropped was the cost of that traffic.
What the search gate is
The gate is described in detail in Deterring bots, but letting people in. In short:
- A search runs only if you are logged in or have a search_ok cookie.
- Without either, you get a page with one button. Press it, and you get the cookie and go back to your search. The cookie lasts a day. Logged-in users never see the page.
- The cookie, and the token behind the button, are signed with a secret only the server knows. The button stops working after an hour.
- The Referer header no longer counts. The botnet faked it, which is how it got past the first version of the gate.
Most of the work happens in nginx, before the database is involved:
- A search with a query, but without a login cookie or a search_ok cookie, is sent to search-gate.php instead of search.php. That page shows the button, with a 403, and never connects to the database.
- Requests for commit.php and vuxml.php without a login cookie get a 401 straight from nginx. PHP never runs.
- nginx only checks that a cookie is there. PHP checks the signature, so a bot with a made-up cookie still gets the button, but only after search.php has opened a database connection.
The empty search form is still open to everyone.
Requests per day
These numbers come from the nginx access log on aws-1-nginx01, which sits in front of the production database. The log, with its rotated copies, goes back to 15 October. That was already the worst day of the botnet, so I have no quiet week to compare against.
Refused means nginx answered with a 401, 403, or 444. None of them reach the database. The 401 and 444 responses come straight from nginx; the 403 is the button page from search-gate.php. Search hits are requests for /search.php or /search-gate.php, whatever the answer.
This is the command, run on aws-1-nginx01:
sudo sh -c 'for f in /var/log/nginx/freshports.org-access.log*; do case $f in *.bz2) bzcat "$f";; *.gz) zcat "$f";; *.xz) xzcat "$f";; *) cat "$f";; esac; done' | awk '{d=substr($4,2,11); t[d]++; b[d]+=$10; if ($9=="401"||$9=="403"||$9=="444") r[d]++; if ($7 ~ /^\/search(-gate)?\.php/) q[d]++} END {for (d in t) printf "%s %d %d %d %.0f\n", d, t[d], r[d], q[d], b[d]/1048576}' | sort -t/ -k3,3n -k2,2M -k1,1n
It prints the day, total requests, refused requests, search hits, and megabytes sent. 29 October was still in progress, so I left it out.
| Day | Requests | Refused | Refused share | Search hits | MB sent |
|---|---|---|---|---|---|
| 15 Oct | 744,322 | 210,873 | 28% | 41,905 | 6,977 |
| 16 Oct | 725,042 | 295,039 | 41% | 63,521 | 6,193 |
| 17 Oct (gate) | 728,369 | 229,191 | 31% | 49,953 | 6,452 |
| 18 Oct | 628,048 | 177,365 | 28% | 18,612 | 5,798 |
| 19 Oct | 846,745 | 340,042 | 40% | 47,689 | 6,341 |
| 20 Oct | 658,637 | 163,243 | 25% | 19,586 | 6,703 |
| 21 Oct | 562,659 | 124,986 | 22% | 23,677 | 6,929 |
| 22 Oct | 695,358 | 166,851 | 24% | 30,418 | 7,848 |
| 23 Oct | 1,125,831 | 667,606 | 59% | 98,901 | 7,610 |
| 24 Oct | 631,841 | 211,097 | 33% | 25,163 | 7,050 |
| 25 Oct | 624,703 | 227,196 | 36% | 21,801 | 6,577 |
| 26 Oct | 607,659 | 152,918 | 25% | 25,920 | 6,547 |
| 27 Oct | 578,212 | 223,205 | 39% | 63,752 | 6,434 |
| 28 Oct | 577,425 | 205,363 | 36% | 34,752 | 6,253 |
Total requests stayed between 560,000 and 850,000 a day. The busiest day in the log, 23 October, came six days after the gate: 1.1 million requests, 59% of them refused. The bots did not give up.
Requests that got past the refusals fell more slowly, from 450,000–530,000 a day in the first week to about 360,000 on 27 and 28 October.
Averaged, the days before and after the gate look like this. These are simple means of the daily totals in the table above.
| Days | Requests a day | Change |
|---|---|---|
| 15–16 Oct, before the gate | 734,700 | |
| 18–28 Oct | 685,200 | -7% |
| 18–28 Oct, without 23 Oct | 641,100 | -13% |
| 24–28 Oct | 604,000 | -18% |
So daily requests drifted down by 10–18% over the following ten days. That is a slow slide, not a step: 19 October was busier than either day before the gate. The two days before are also both from the middle of the botnet, because that is as far back as the log goes. The gate's real effect is not in the number of requests. It is in what those requests cost the database.
Search is where the gate shows. Between 19,000 and 99,000 requests a day still ask for a search. In the first 28 hours after the release, only 504 searches actually ran. That count comes from pg_stat_statements, by counting calls of the query that counts search results. It ran once per search:
SELECT sum(calls)
  FROM pg_stat_statements
 WHERE regexp_replace(query, '\s+', ' ', 'g') ILIKE '%SELECT count(*) FROM ports P , categories C, element E%';
Nearly every one of those search requests got a refusal or the challenge page.
Before the bots
The access log can't tell me what a normal week looked like, but LibreNMS can. It graphs requests per second on aws-1-nginx01. This is 7 October to 13 October:
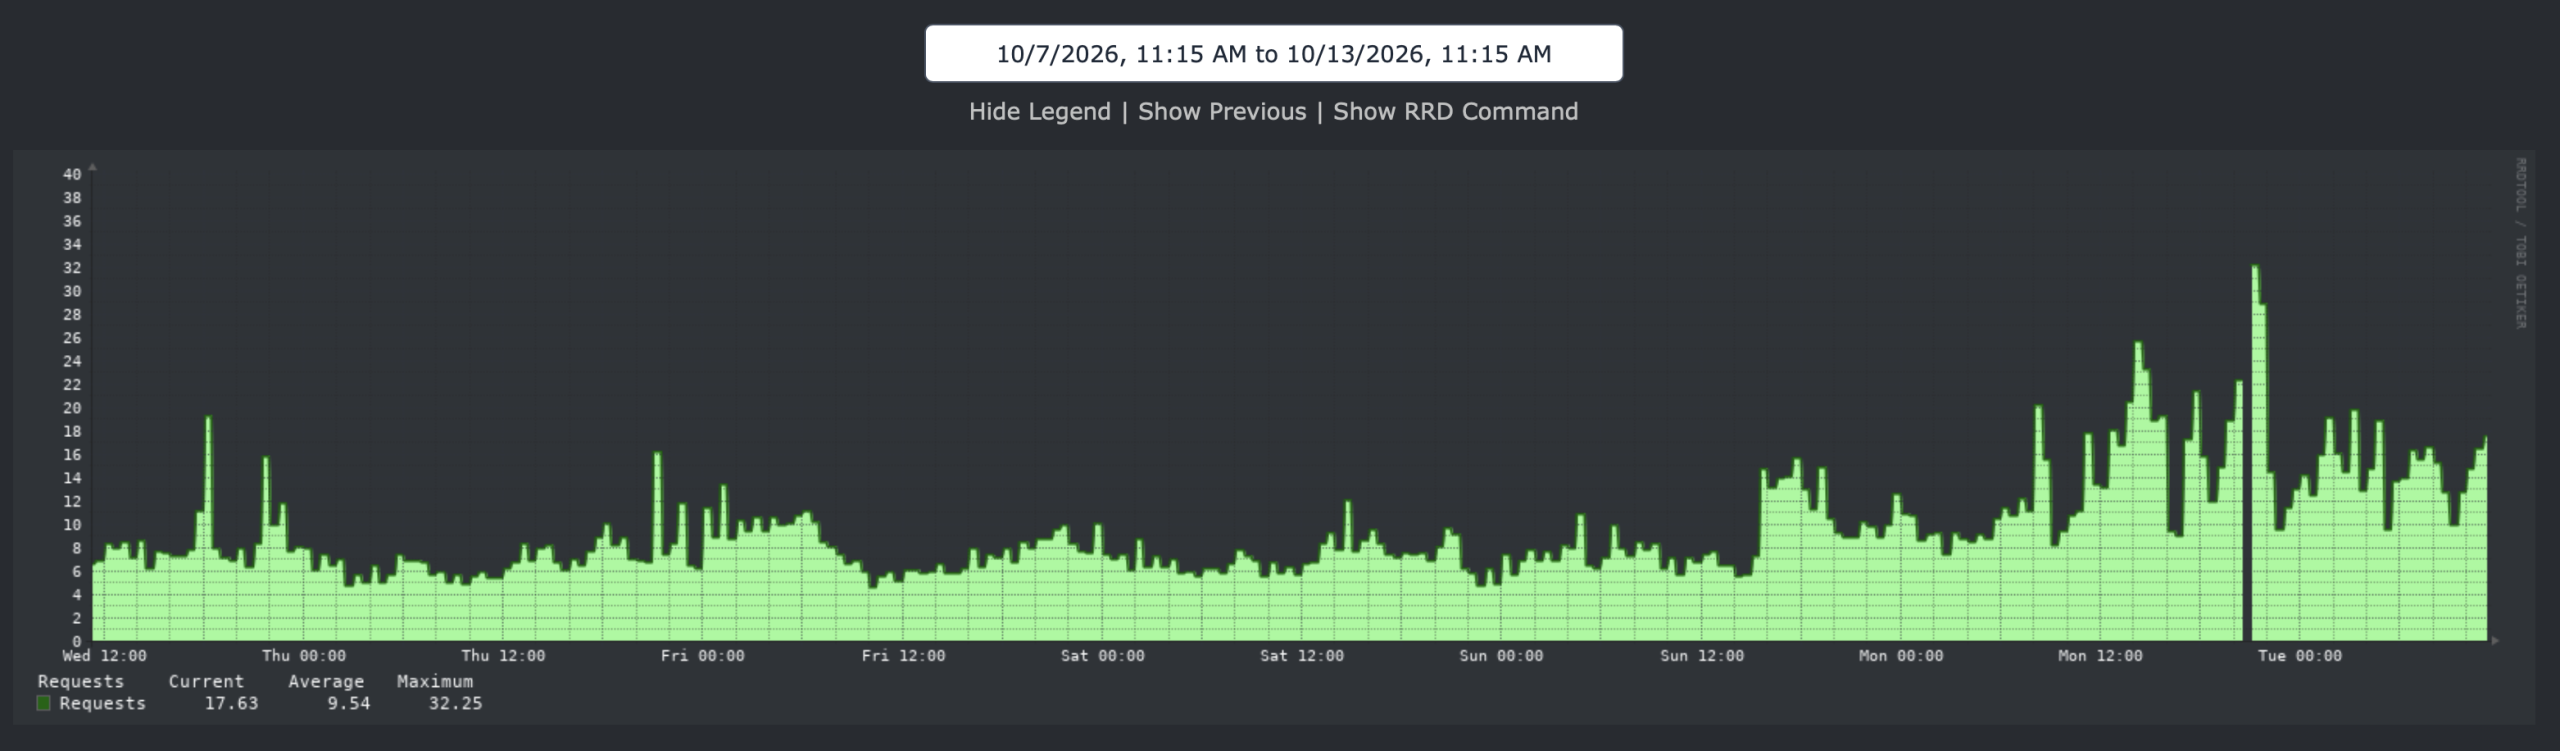
From Wednesday to Sunday, traffic sat at 5–10 requests a second, with the odd spike to 16–19. On Sunday afternoon it stepped up to about 14, and on Monday it climbed to 20–25, peaking at 32 late that night. On Tuesday morning it was still 10–18. The average for the week was 9.54 requests a second, the maximum 32.25. The bots were already arriving a few days before search got slow on 14 October.
The graph is LibreNMS's nginx requests graph for that host. The average and maximum are from the graph's legend.
Before and after
Here is the same graph from 7 October to 29 October:
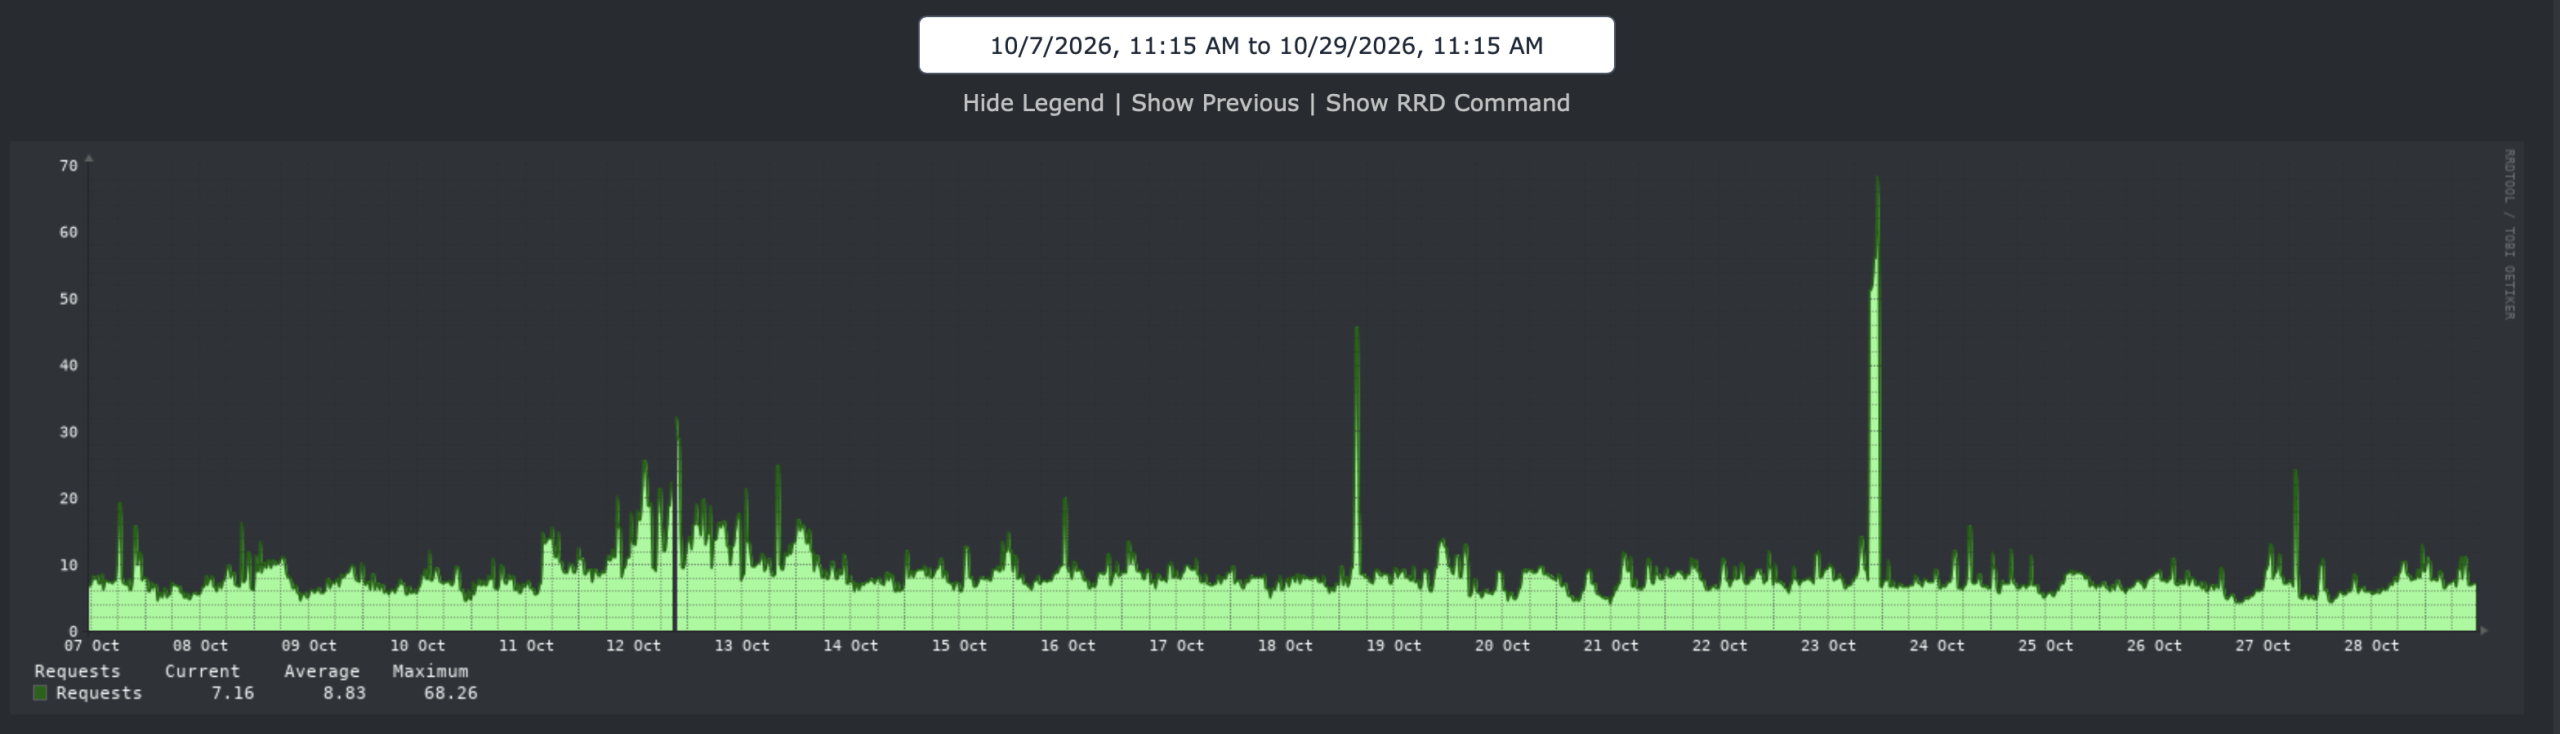
The busy stretch from 11 October to 13 October is the bump in the middle. By 14 October traffic was back to 6–10 requests a second, and that is where it has stayed. The gate went in at 10:17 on 17 October, and there is no step down there at all. The spikes since then are bursts the gate refused: 46 requests a second on 18 October, 68 on 23 October, and 24 on 27 October.
The log and the graph agree. On 27 and 28 October the log shows about 578,000 requests a day, which is 6.7 a second (578,000 divided by 86,400 seconds). That is about what the graph shows for those days, and about what it showed for 7 to 10 October, before the bots.
New users
Search has needed a login for a long time. On 22 April I added LOGIN_TO_SEARCH, LOGIN_TO_VIEW_COMMIT, and LOGIN_TO_VIEW_VUXML, because a bot was working through those pages. From then on, the only way to search FreshPorts was to have an account. The first search gate, on 9 October, let people search without one again.
The users table records when each account was created, in firstlogin. Its default is the time the row was inserted. I counted new accounts per day, and per month for the past year:
SELECT (firstlogin AT TIME ZONE 'UTC')::date AS day,
       count(*)                              AS new_users,
       count(*) FILTER (WHERE status = 'A')  AS activated
  FROM users
 WHERE firstlogin >= '2026-09-01'
 GROUP BY 1
 ORDER BY 1;

SELECT date_trunc('month', firstlogin AT TIME ZONE 'UTC')::date AS month,
       count(*) AS new_users
  FROM users
 WHERE firstlogin >= '2025-10-01'
 GROUP BY 1
 ORDER BY 1;
The periods below add up those daily and monthly counts. Here are the new accounts:
| Period | New accounts | Per day |
|---|---|---|
| October 2025 to March 2026 | 33–72 a month | 1–2 |
| May to September 2026, login needed to search | 120–275 a month | 4–9 |
| 1–8 October, login needed to search | 24 | 3 |
| 9–14 October, first gate | 24 | 4 |
| 15–17 October, login needed to search | 6 | 2 |
| 18–28 October, after the gate | 8 | 0.7 |
April had 135 new accounts, about twice the usual, and the login requirement only started on the 22nd. May had 275. Sign-ups then tailed off over the summer, but stayed well above the months before April. Since the gate went in, they have nearly stopped: eight in eleven days, with none at all from 18 to 21 October. That is below even the quiet months of late 2025.
Were the extra accounts people, or bots signing up to get past the login? I looked at two things for each account: whether it was seen again more than a day after it was created, and whether it watches any ports.
SELECT date_trunc('month', U.firstlogin AT TIME ZONE 'UTC')::date AS month,
       count(*) AS new_users,
       count(*) FILTER (WHERE U.lastlogin > U.firstlogin + interval '1 day') AS came_back,
       count(*) FILTER (WHERE EXISTS (SELECT 1 FROM watch_list WL JOIN watch_list_element WLE ON WLE.watch_list_id = WL.id WHERE WL.user_id = U.id)) AS watches_ports
  FROM users U
 WHERE U.firstlogin >= '2025-10-01'
 GROUP BY 1
 ORDER BY 1;
Added up by period:
| Accounts created | New accounts | Seen again | Watch ports |
|---|---|---|---|
| October 2025 to March 2026 | 344 | 215 (62%) | 37 (11%) |
| April to September 2026 | 1,027 | 657 (64%) | 47 (5%) |
The newer accounts came back just as often, but were less than half as likely to watch a port. That is what you would expect from people who signed up to search, not to keep track of ports. A logged-in bot would also come back and never watch anything, so this doesn't rule bots out. But the simplest reading is that the login requirement made people create accounts, and the gate means they no longer have to.
The lastlogin column doesn't help here. It is updated on every page a logged-in user views, so it records when each user was last seen. Each user only shows up on their most recent day, and any count by day rises toward today.
What it costs the database
The number I care about is database time, which I give in seconds per hour (s/hour). Here is how it is measured.
Production runs the pg_stat_statements extension. For each distinct query, it keeps a running total of the time spent executing it, in total_exec_time. I reset the statistics with pg_stat_statements_reset(), wait, then add up total_exec_time across every query and divide by the hours since the reset:
SELECT sum(total_exec_time) / 1000
     / (extract(epoch FROM now() - stats_reset) / 3600) AS seconds_per_hour
  FROM pg_stat_statements, pg_stat_statements_info;
Some things to know about that number:
- It is query execution time only. Planning time is not counted, because pg_stat_statements.track_planning is off by default. Neither is time spent in PHP, nginx, or on the network.
- It is summed across all connections. Ten queries running for one second at the same time count as ten seconds. 188 s/hour means the database spent about 5% of one CPU's hour running queries, on average.
- It counts every query, not just searches. That includes the nightly pg_dump, which took about 53 s/hour of the 188.
- To compare like with like, each window covers the same hours of the day, so both include the nightly dump.
- pg_stat_statements only keeps so many distinct queries. When it fills up, it evicts the least-used, and their time goes with them. So a window much longer than a day undercounts. I check pg_stat_statements_info.dealloc to see whether that has happened.
Each figure below comes from that query, run at the end of the window, after a reset at its start:
| Window | Database time |
|---|---|
| Before the October release | 471 s/hour |
| First 28 hours with the gate | 401 s/hour |
| 20–21 October, with the gate and the query fixes | 188 s/hour (about 134 without the dump) |
Not all of that drop is the gate. The same release made searches and list pages much faster. The count query behind search went from 1,676 ms to 20 ms. Those are mean_exec_time values from pg_stat_statements, from the October speed-up post. The gate's part is that the refused requests never reach the database at all. Before the gate, each refusal still started PHP and opened a database connection. Now nginx either refuses them itself or hands them to a small page that never touches the database.
Search is faster too
FreshPorts records how long each page took to render in page_load_detail. Only searches that actually run are recorded. Refusals and the button page are not, so the bots don't skew these numbers. Detail rows are kept for about eight days, so the before numbers come from the October speed-up post, which used the same table at the time.
The after numbers come from this query:
SELECT date_trunc('week', date)::date AS week,
       user_id IS NOT NULL            AS logged_in,
       count(*)                       AS searches,
       round(avg(extract(epoch FROM rendering_time))::numeric, 3) AS avg_s,
       round(percentile_cont(0.5)  WITHIN GROUP (ORDER BY extract(epoch FROM rendering_time))::numeric, 3) AS p50_s,
       round(percentile_cont(0.95) WITHIN GROUP (ORDER BY extract(epoch FROM rendering_time))::numeric, 3) AS p95_s,
       round(max(extract(epoch FROM rendering_time))::numeric, 3) AS max_s
  FROM page_load_detail
 WHERE page_name = '/search.php'
   AND full_url ~ '[?&]query=[^&]'
   AND date >= '2026-09-01'
 GROUP BY 1, 2
 ORDER BY 1, 2;
It splits logged-in and anonymous searches. The table rounds the two together.
| Searches | Median | 95th percentile |
|---|---|---|
| Week before 15 October, logged-in name searches | 1.4 s | 2.7 s |
| 15 October, logged-in name searches | 2.3 s | 8.4 s |
| 19–25 October, all searches | 0.09 s | 0.23 s |
| 26–29 October, all searches | 0.08 s | 0.18–0.26 s |
A typical search now takes under a tenth of a second, where it used to take well over one. Almost all of that is the faster queries in the release, not the gate. What the gate does is keep it that way: with the bots refused before they reach the database, the slowest search in the last ten days took 4.1 seconds. The worst hour on 15 October averaged 21 seconds.
More searches are running, too. From 19 to 25 October, 4,379 searches ran, about 625 a day. Before the bots arrived it was 200–330 a day. About 60% of them come from visitors who are not logged in and pressed the button. I don't yet know how many of those are people. Pressing a button is not hard for a bot that cares to try.
Are the anonymous searches people?
To find out, I compared the anonymous searches with the logged-in ones, on the assumption that logged-in users are people. This covers 21 to 29 October, which is what page_load_detail still held:
CREATE TEMP VIEW s AS
SELECT user_id IS NOT NULL AS logged_in,
       ip_address,
       network(set_masklen(ip_address, CASE family(ip_address) WHEN 4 THEN 24 ELSE 48 END)) AS net,
       coalesce(nullif(substring(full_url FROM '[?&]stype=([^&#]*)'), ''), 'name') AS stype,
       lower(substring(full_url FROM '[?&]query=([^&#]*)')) AS q,
       date + time AS ts
  FROM page_load_detail
 WHERE page_name = '/search.php'
   AND full_url ~ '[?&]query=[^&]';

-- overall: how spread out, how varied
SELECT logged_in,
       count(*)                                            AS searches,
       count(DISTINCT ip_address)                          AS ips,
       count(DISTINCT net)                                 AS nets,
       round(count(*)::numeric / count(DISTINCT ip_address), 1) AS per_ip,
       count(DISTINCT q)                                   AS distinct_queries,
       round(100.0 * count(*) FILTER (WHERE stype = 'depends_all') / count(*), 1) AS pct_depends_all,
       round(100.0 * count(*) FILTER (WHERE stype = 'maintainer')  / count(*), 1) AS pct_maintainer,
       min(ts), max(ts)
  FROM s GROUP BY 1;

-- hour of day (UTC)
SELECT extract(hour FROM ts) AS hour,
       count(*) FILTER (WHERE NOT logged_in) AS anon,
       count(*) FILTER (WHERE logged_in)     AS logged_in
  FROM s GROUP BY 1 ORDER BY 1;
| Anonymous | Logged in | |
|---|---|---|
| Searches | 3,640 | 2,539 |
| Addresses | 1,319 | 681 |
| Searches per address | 2.8 | 3.7 |
| Different queries, as a share of searches | 37% | 39% |
| "Depends on this port (all)" searches | 0.3% | 0.2% |
| Maintainer searches | 0.7% | 0.7% |
The two groups look alike. During the botnet, "depends on this port (all)" and maintainer searches made up most of the anonymous traffic. Now they are under 1% for both groups, and 97% of searches are plain name searches. Both groups follow the clock: the quietest hours are around midnight UTC, and the busiest are 14:00 to 19:00, when Europe and the Americas are both awake. A botnet doesn't sleep.
The busiest anonymous addresses look like people too. The top one ran 59 searches in two and a half hours, 56 of them different. Most of the others did 15 to 40 searches in an hour or two, then stopped.
Then I looked at the browsers behind the button presses, which are a POST to /search-gate.php answered with a 303:
sudo sh -c 'for f in /var/log/nginx/freshports.org-access.log*; do case $f in *.bz2) bzcat "$f";; *.gz) zcat "$f";; *.xz) xzcat "$f";; *) cat "$f";; esac; done' | awk -F'"' '$2 ~ /^POST \/search-gate\.php/ && $3 ~ / 303 / {print $6}' | sort | uniq -c | sort -rn | head -20
From 15 October to midday on 29 October, the button was pressed 2,249 times. These are the twenty most common user agents, which account for 1,506 of those presses:
| Presses | Browser | User agent |
|---|---|---|
| 361 | Firefox 158, Linux | Mozilla/5.0 (X11; Linux x86_64; rv:158.0) Gecko/20100101 Firefox/158.0 |
| 178 | Firefox 158, Windows | Mozilla/5.0 (Windows NT 10.0; Win64; x64; rv:158.0) Gecko/20100101 Firefox/158.0 |
| 121 | Firefox 153, Linux | Mozilla/5.0 (X11; Linux x86_64; rv:153.0) Gecko/20100101 Firefox/153.0 |
| 109 | Chrome 155, Windows | Mozilla/5.0 (Windows NT 10.0; Win64; x64) AppleWebKit/537.36 (KHTML, like Gecko) Chrome/155.0.0.0 Safari/537.36 |
| 99 | Firefox 157, Linux | Mozilla/5.0 (X11; Linux x86_64; rv:157.0) Gecko/20100101 Firefox/157.0 |
| 90 | Firefox 158, macOS | Mozilla/5.0 (Macintosh; Intel Mac OS X 10.15; rv:158.0) Gecko/20100101 Firefox/158.0 |
| 61 | Chrome 156, Windows | Mozilla/5.0 (Windows NT 10.0; Win64; x64) AppleWebKit/537.36 (KHTML, like Gecko) Chrome/156.0.0.0 Safari/537.36 |
| 60 | Chrome 155, Android | Mozilla/5.0 (Linux; Android 10; K) AppleWebKit/537.36 (KHTML, like Gecko) Chrome/155.0.0.0 Mobile Safari/537.36 |
| 56 | Safari 27.0.1, macOS | Mozilla/5.0 (Macintosh; Intel Mac OS X 10_15_7) AppleWebKit/605.1.15 (KHTML, like Gecko) Version/27.0.1 Safari/605.1.15 |
| 53 | Chrome 155, Linux | Mozilla/5.0 (X11; Linux x86_64) AppleWebKit/537.36 (KHTML, like Gecko) Chrome/155.0.0.0 Safari/537.36 |
| 48 | Firefox ESR 140, Linux | Mozilla/5.0 (X11; Linux x86_64; rv:140.0) Gecko/20100101 Firefox/140.0 |
| 44 | Chrome 155, macOS | Mozilla/5.0 (Macintosh; Intel Mac OS X 10_15_7) AppleWebKit/537.36 (KHTML, like Gecko) Chrome/155.0.0.0 Safari/537.36 |
| 43 | Edge 155, Windows | Mozilla/5.0 (Windows NT 10.0; Win64; x64) AppleWebKit/537.36 (KHTML, like Gecko) Chrome/155.0.0.0 Safari/537.36 Edg/155.0.0.0 |
| 36 | Safari 27.0.1, iPhone | Mozilla/5.0 (iPhone; CPU iPhone OS 18_7 like Mac OS X) AppleWebKit/605.1.15 (KHTML, like Gecko) Version/27.0.1 Mobile/15E148 Safari/604.1 |
| 31 | Firefox 158, Android | Mozilla/5.0 (Android 16; Mobile; rv:158.0) Gecko/158.0 Firefox/158.0 |
| 25 | Chrome 156, Linux | Mozilla/5.0 (X11; Linux x86_64) AppleWebKit/537.36 (KHTML, like Gecko) Chrome/156.0.0.0 Safari/537.36 |
| 25 | Safari 27.0, macOS | Mozilla/5.0 (Macintosh; Intel Mac OS X 10_15_7) AppleWebKit/605.1.15 (KHTML, like Gecko) Version/27.0 Safari/605.1.15 |
| 23 | Firefox 157, Windows | Mozilla/5.0 (Windows NT 10.0; Win64; x64; rv:157.0) Gecko/20100101 Firefox/157.0 |
| 23 | Edge 156, Windows | Mozilla/5.0 (Windows NT 10.0; Win64; x64) AppleWebKit/537.36 (KHTML, like Gecko) Chrome/156.0.0.0 Safari/537.36 Edg/156.0.0.0 |
| 20 | Chrome 156, Android | Mozilla/5.0 (Linux; Android 10; K) AppleWebKit/537.36 (KHTML, like Gecko) Chrome/156.0.0.0 Mobile Safari/537.36 |
They are current browsers: Firefox 157 and 158 on Linux, Windows, and macOS, Chrome and Edge 155 and 156, Safari 27, Firefox ESR 140, and phones. Linux shows up more than it would on most sites, which is what I would expect from people looking up FreeBSD ports. The botnet claimed to be Windows Chrome 142 to 153. None of those are in the top twenty.
Since 24 October, the button has been pressed about 165 times a day. The 2,249 total and the daily figure come from counting presses per day:
sudo sh -c 'for f in /var/log/nginx/freshports.org-access.log*; do case $f in *.bz2) bzcat "$f";; *.gz) zcat "$f";; *.xz) xzcat "$f";; *) cat "$f";; esac; done' | awk -F'"' '$2 ~ /^POST \/search-gate\.php/ && $3 ~ / 303 / {split($1, a, "["); print substr(a[2], 1, 11)}' | sort | uniq -c | sort -k2,2
   4 15/Oct/2026
  56 17/Oct/2026
 112 18/Oct/2026
 144 19/Oct/2026
 108 20/Oct/2026
 380 21/Oct/2026
 334 22/Oct/2026
 211 23/Oct/2026
 167 24/Oct/2026
 162 25/Oct/2026
 165 26/Oct/2026
 177 27/Oct/2026
 161 28/Oct/2026
  68 29/Oct/2026
So the anonymous searches look like people. The gate seems to be doing what it was meant to: keeping the bots out and letting people in.
Conclusion
The bots are still here, sending as many requests as before, and on some days more. The difference is that they now cost an nginx lookup instead of a database query. I can live with that.
