I was checking email this (Friday Jul 19, 2024) morning, over coffee, while many IT folks dealt with Cloudstrike fallout, when I noticed this message from the logs:
Jul 19 09:12:18 zuul kernel: [zone: pf states] PF states limit reached
I’ve seen that message before. It’s not of high concern. That server contains many services including PGCon, the former BSDCan website, and my blogs. I didn’t give it much concern, although I should follow that up.
This post has nothing to do with that. It was what started me looking at graphs and I went down a different path. At the end, there is some resolution, but not 100%. Prepare to not have a definite answer.
I went to look at my LibreNMS graphs. I noticed something interesting: gaps.
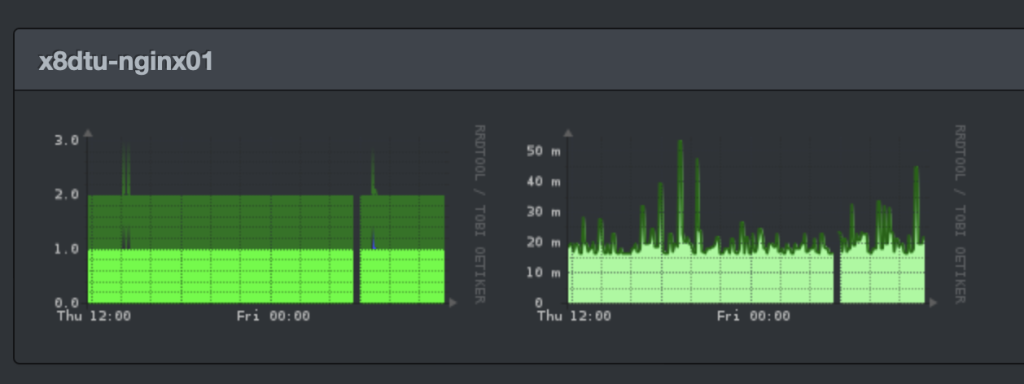
Yesterday, I noticed a similar gap, so I went to the main page for this service. There I saw regular recurring gaps. Hmm.
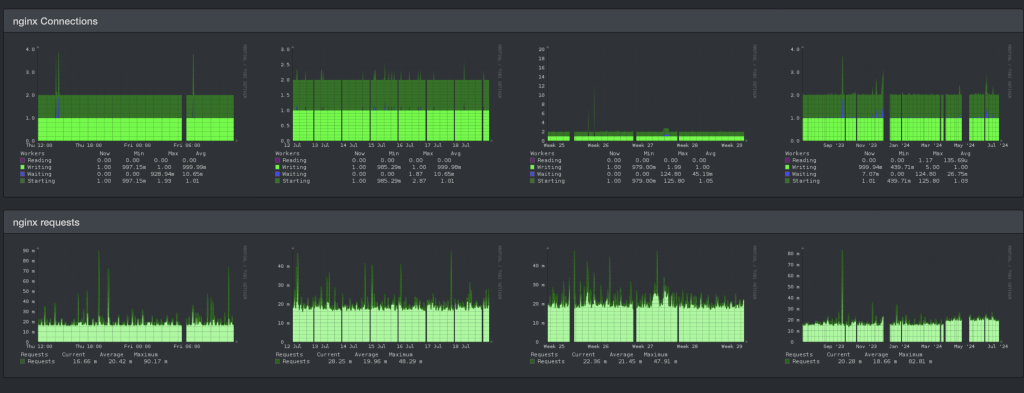
In the graphs above (first row, second column) you can see gaps appearing daily, always at about the same time of day.
This host is not particularly beefy but has been a work-horse for a long time, hosting FreshPorts for many years. After a power supply failure a few years back, FreshPorts was moved to an AWS instance. This host still runs FreshPorts services, but is not in production use.
Let’s look at today’s data:
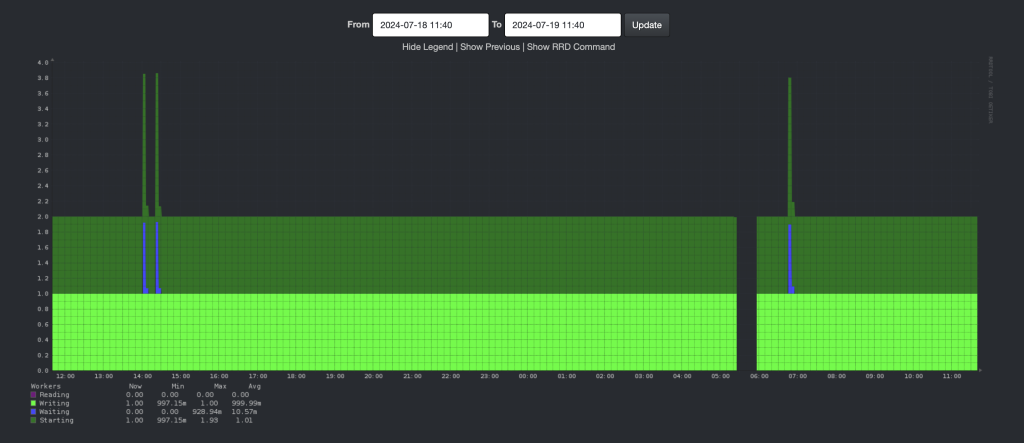
If the gap is that regular, I suspect it’s related to cron jobs, probably a backup.
Zoom in
This graph was generated Saturday morning.
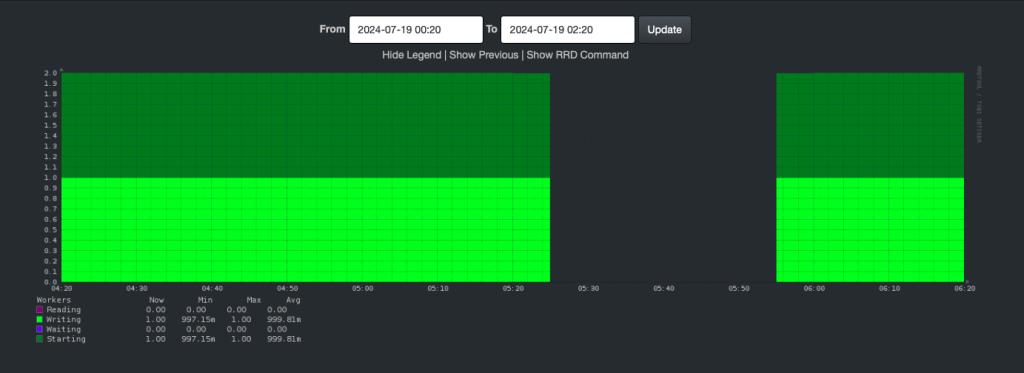
I figure the gap is from 5:25 to 5:55. Notice the difference between my search values and the display values. I know my personal preference is for UTC. Right now, it is 8:00 AM local time and 12:00 UTC – which means, the graph time is probably 1:25-1:55 AM, local time. However, I suspect the hours may be wrong, but I’m sure the minutes are correct. The server is on UTC. More later in this post.
Looking elsewhere
This is the disk IO for that host for the past 48 hours (again, this graph was done on Saturday morning).
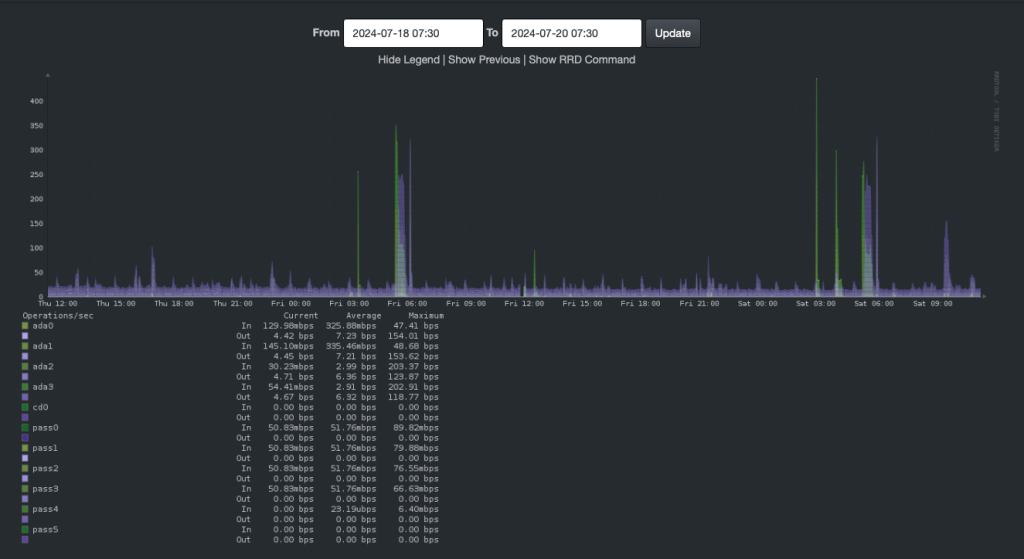
Look at that bump, at about the same time as the gap.
Let’s zoom in, using the same times as the previous graph.
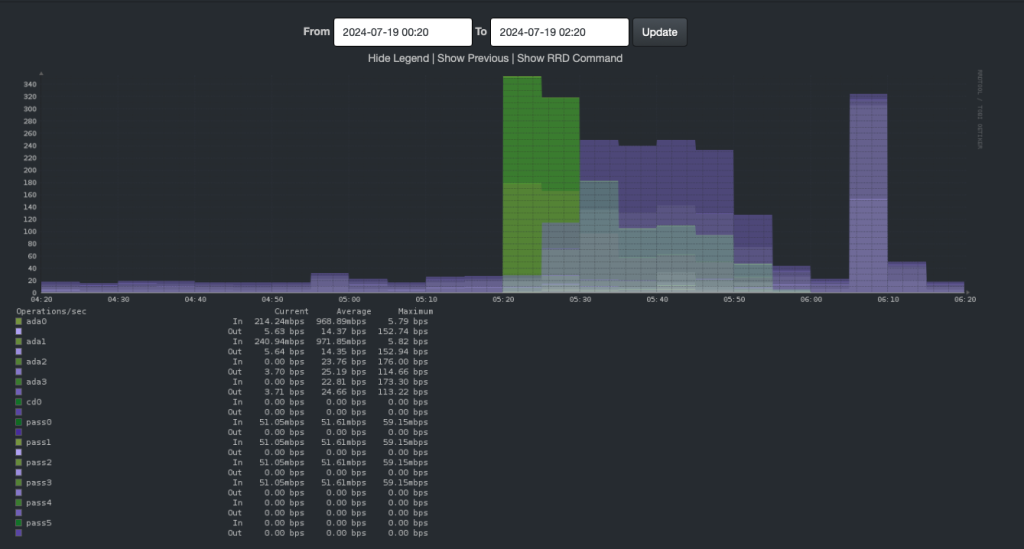
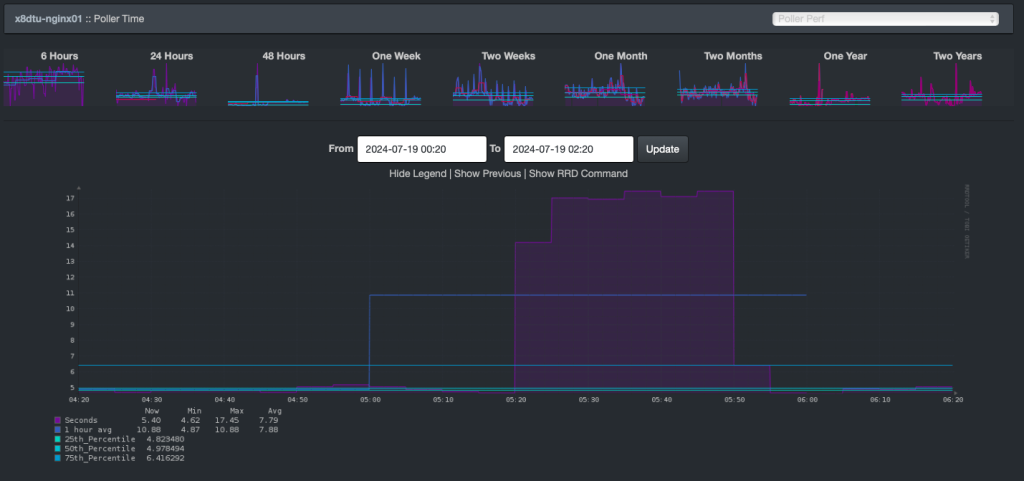
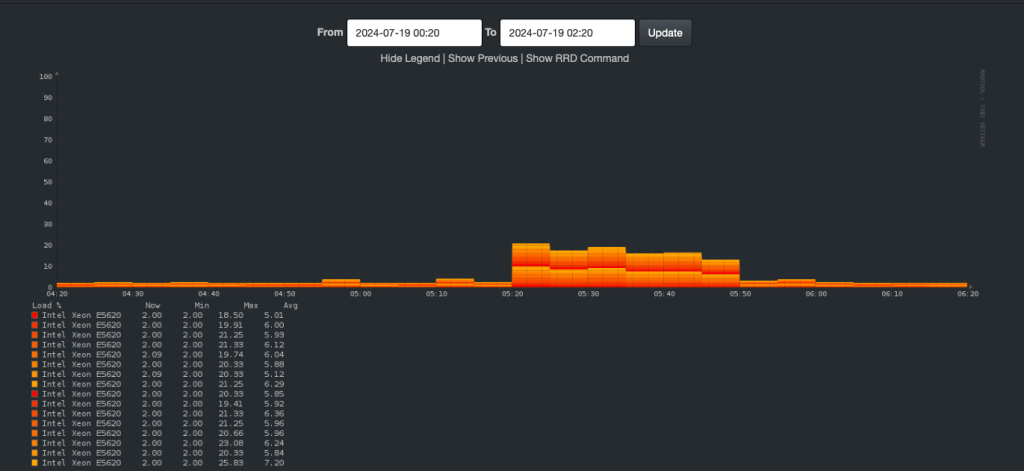
That’s what I think caused the gap. Heavy disk IO, low memory, high CPU. Which led to snmpd not being able to respond in time.
This graph shows the increased polling times (how long it takes for the client to respond to LibreNMS):
Did I say CPU:
What about RAM? Again, this is being looked at on Saturday morning.
In this graph, RAM is sitting nicely at about 55GB until 5:20 when it jumps to 73GB. At 5:25, it jumps again to about 79GB.
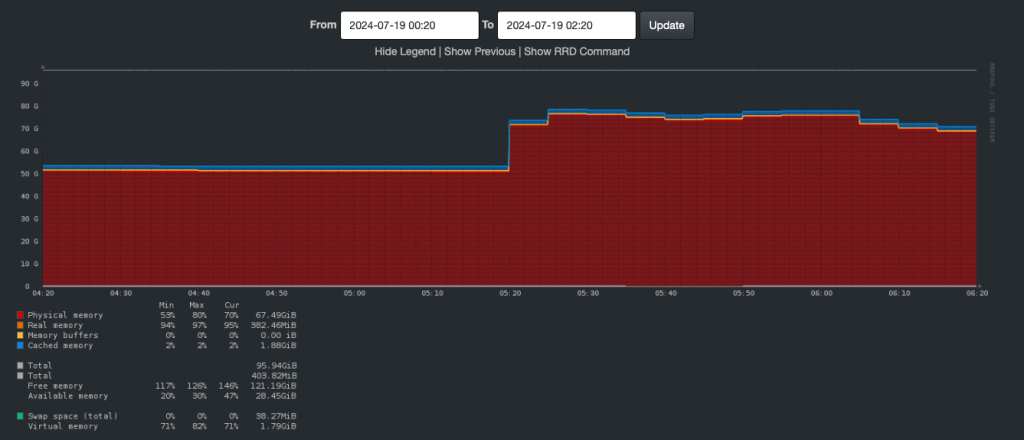
So not RAM exhaustion.
Network IO, look at this. It also spikes. That’s a bit of a bump in traffic. Traffic goes from way belong 0.1 M to 0.2 M at 5:20. It drops to 0.1 M between 5:30 and 5:45. And spikes again to 1.9 M at 5:45. By 6:00, it’s back to normal
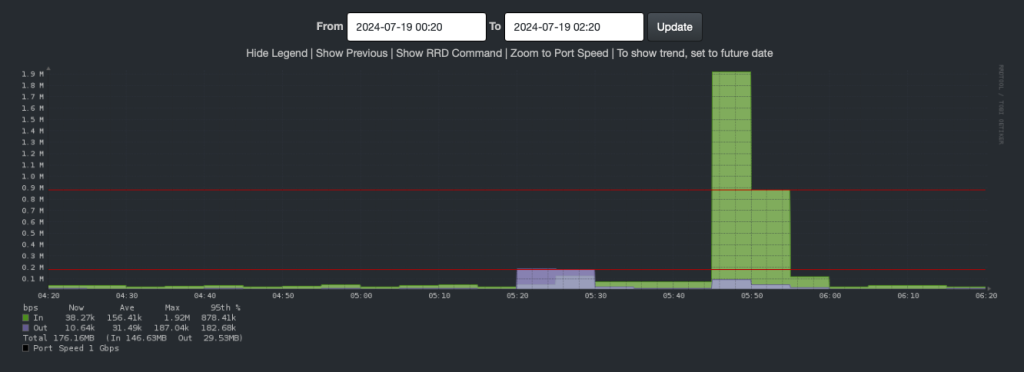
So what’s causing all this
I think it’s my backup. Looking in emails from the Bacula backups, I see:
  Scheduled time:         19-Jul-2024 03:05:02
  Start time:             19-Jul-2024 03:05:12
  End time:               19-Jul-2024 03:10:18
  Elapsed time:           5 mins 6 secs
That doesn’t relate to the time frames captured above. I first convinced myself it was time zone issues, adding/subtracting to/from UTC to get local time. No, that didn’t fit either.
It was something else.
Another type of backup
I had looked at this before, but not closely enough. It’s the rsyncer user copying stuff around. I created that user to do stuff like copy database dumps from hosts to a central backup server. It also takes stuff from that server to other hosts.
Case in point (you might have to scroll that output to the right to see it all):
[13:12 x8dtu dvl ~] % sudo crontab -l -u rsyncer
MAILTO=dan@example.org

# take a local copy of the bacula stuff

15     *        *       *       *       /usr/bin/lockf -t 0 /tmp/.rsync.bacula.config.lock   ${HOME}/bin/rsync-bacula-config.files.sh >> /var/log/rsync-bacula-config.files.log
22     2/3      *       *       *       /usr/bin/lockf -t 0 /tmp/.rsync.bacula.database.lock ${HOME}/bin/rsync-bacula-database.sh     >> /var/log/rsync-bacula-database.log
For more information on lockf and why you want it in all your cronjob, see avoiding duplicate cronjobs. Yes, even those cronjobs which you think take only a few seconds to run.
Look at that second cronjob. You might wonder, wtf is that 2/3 doing in a cronjob?
Let me extol the virtues of crontab guru where it says: “At minute 22 past every 3rd hour from 2 through 23.”
That means this would launch at 2:22, 5:22, 7:22, etc. Those times match up with the gaps.
Let’s look at those logs. Save your logs. One day, they’l be useful.
[13:15 x8dtu dvl ~] % ls -tl  /var/log/rsync-bacula-database.log* | head
-rw-r-----  1 rsyncer wheel 2195 2024.07.20 11:22 /var/log/rsync-bacula-database.log
-rw-r-----  1 rsyncer wheel 4316 2024.07.20 00:00 /var/log/rsync-bacula-database.log.0
-rw-r-----  1 rsyncer wheel 4315 2024.07.19 00:00 /var/log/rsync-bacula-database.log.1
-rw-r-----  1 rsyncer wheel 4315 2024.07.18 00:00 /var/log/rsync-bacula-database.log.2
-rw-r-----  1 rsyncer wheel 4317 2024.07.17 00:00 /var/log/rsync-bacula-database.log.3
-rw-r-----  1 rsyncer wheel 4319 2024.07.16 00:00 /var/log/rsync-bacula-database.log.4
-rw-r-----  1 rsyncer wheel 4318 2024.07.15 00:00 /var/log/rsync-bacula-database.log.5
-rw-r-----  1 rsyncer wheel 4315 2024.07.14 00:00 /var/log/rsync-bacula-database.log.6
-rw-r-----  1 rsyncer wheel 4319 2024.07.13 00:00 /var/log/rsync-bacula-database.log.7
-rw-r-----  1 rsyncer wheel 4318 2024.07.12 00:00 /var/log/rsync-bacula-database.log.8
Yes, those logs are being rotated daily by this:
[13:42 x8dtu dvl ~] % cat /usr/local/etc/newsyslog.conf.d/rsync.log.conf
# logfilename               [owner:group]    mode count size when  flags [/pid_file]
# [sig_num]
# see /etc/crontab for where flushlogs is invoked
#
# these logs are not appended to at the top of the hour, but for a big
# rsync, the file might be rotated out from under them. That's OK.
#
/var/log/rsync-bacula-*.log rsyncer:wheel    640  30    *    @T00  BCG
I know which log to look at, and we want the second entry in that log:
[13:15 x8dtu dvl ~] % cat /var/log/rsync-bacula-database.log.0
receiving incremental file list

Number of files: 1 (reg: 1)
Number of created files: 0
Number of deleted files: 0
Number of regular files transferred: 0
Total file size: 178,917,386,063 bytes
Total transferred file size: 0 bytes
Literal data: 0 bytes
Matched data: 0 bytes
File list size: 61
File list generation time: 0.001 seconds
File list transfer time: 0.000 seconds
Total bytes sent: 20
Total bytes received: 72

sent 20 bytes  received 72 bytes  184.00 bytes/sec
total size is 178,917,386,063  speedup is 1,944,754,196.34
receiving incremental file list
bacula.dump

Number of files: 1 (reg: 1)
Number of created files: 0
Number of deleted files: 0
Number of regular files transferred: 1
Total file size: 178,917,494,736 bytes
Total transferred file size: 178,917,494,736 bytes
Literal data: 97,275,856 bytes
Matched data: 178,820,218,880 bytes
File list size: 60
File list generation time: 0.001 seconds
File list transfer time: 0.000 seconds
Total bytes sent: 12,286,079
Total bytes received: 102,757,482

sent 12,286,079 bytes  received 102,757,482 bytes  62,779.57 bytes/sec
total size is 178,917,494,736  speedup is 1,555.22
receiving incremental file list

Number of files: 1 (reg: 1)
Number of created files: 0
Number of deleted files: 0
Number of regular files transferred: 0
Total file size: 178,917,494,736 bytes
Total transferred file size: 0 bytes
Literal data: 0 bytes
Matched data: 0 bytes
File list size: 60
File list generation time: 0.001 seconds
File list transfer time: 0.000 seconds
Total bytes sent: 20
Total bytes received: 71

sent 20 bytes  received 71 bytes  60.67 bytes/sec
total size is 178,917,494,736  speedup is 1,966,126,315.78
receiving incremental file list

Number of files: 1 (reg: 1)
Number of created files: 0
Number of deleted files: 0
Number of regular files transferred: 0
Total file size: 178,917,494,736 bytes
Total transferred file size: 0 bytes
Literal data: 0 bytes
Matched data: 0 bytes
File list size: 60
File list generation time: 0.001 seconds
File list transfer time: 0.000 seconds
Total bytes sent: 20
Total bytes received: 71

sent 20 bytes  received 71 bytes  60.67 bytes/sec
total size is 178,917,494,736  speedup is 1,966,126,315.78
OK, the second entry is definitely the one which transferred data, 102,757,482 bytes, or about 98 MB.
Doing the math 102,757,482 bytes / 62,779.57 bytes/second = 1,636 seconds – or about 28 minutes.
That exactly matches the time period from the graphs above: 5:25 to 5:55 – LibreNMS is configured to query the hosts every 5 minutes.
Now I know what process is causing the gap issue: it’s rsync, copying data to this host.
Fixing the gap
Again, I am writing this on Saturday, having taken corrective action on Friday morning. Here is my /boot/loader.conf file on that host.
This host has about 98GB of RAM (based on this entry from /var/run/dmesg.boot: real memory = 103083409408 (98308 MB)) When I ran top on that host on Friday morning, I thought I noticed RAM being low, as in about 1200MB free. I don’t have a record of that and did not include that line in the paste from top which appears below. The non-highlighted lines are provided only for your amusement. This host has been in my use for at least 7 years. Some of these settings are old…
[13:15 x8dtu dvl ~] % cat /boot/loader.conf
vfs.zfs.debug="1"
kern.geom.label.disk_ident.enable="0"
kern.geom.label.gptid.enable="0"
zfs_load="YES"

# for core temperatures via nagios
coretemp_load="YES"

# iocage is messed up. see https://github.com/iocage/iocage/issues/894#issuecomment-493786157
#kern.racct.enable="1"

# Getting too much ARC used, and I notice Home Assistant not starting
# promptly.
#
# ARC: 38G Total, 8588M MFU, 27G MRU, 5380K Anon, 214M Header, 2560M Other
#      32G Compressed, 81G Uncompressed, 2.50:1 Ratio
# Swap: 40G Total, 30M Used, 40G Free
#
vfs.zfs.arc_max="20000M"


cpu_microcode_load="YES"
cpu_microcode_name="/boot/firmware/intel-ucode.bin"

# re: https://forums.freebsd.org/threads/freebsd-sysctl-vfs-zfs-dmu_offset_next_sync-and-openzfs-zfs-issue-15526-errata-notice-freebsd-bug-275308.91136/
#vfs.zfs.dmu_offset_next_sync=0
The key point: I restricted ZFS ARC to 20000M (about 18-20GB). Then I run a shutdown -r +1 to reboot.
Notes: I always use shutdown, not reboot – there was a time I thought, and perhaps still do, believed that the two commands resulted in different things. Specifically, the latter did not run the shutdown scripts. I recall some discussion over whether that was accurate. However, I still use shutdown.
Why +1 and not now? Error correction. It gives me a minute to review. Imagine me thinking: Right host? Yes. reboot or power off? OK, that looks good, nothing for me to do here.
The next day
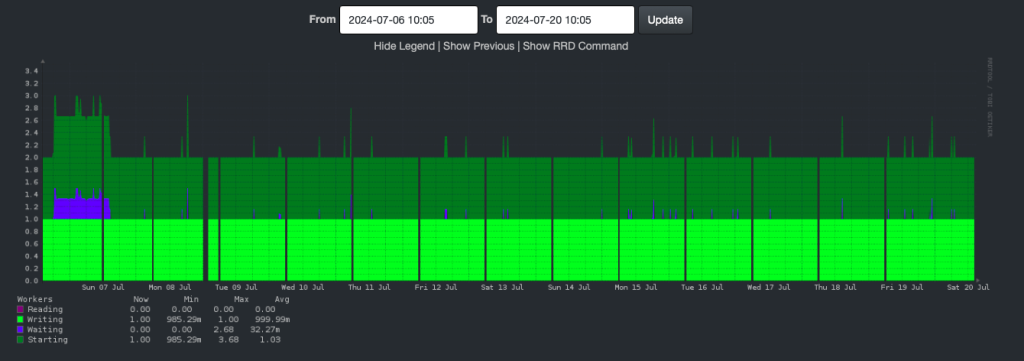
Here’s the graph the next day, for the same time period. No gaps.
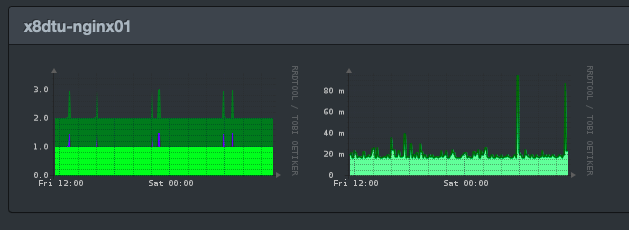
When we look at the overall graphs, we can’t see any historical gaps, which we did in the second image on this page. Why is that? Compression I think.
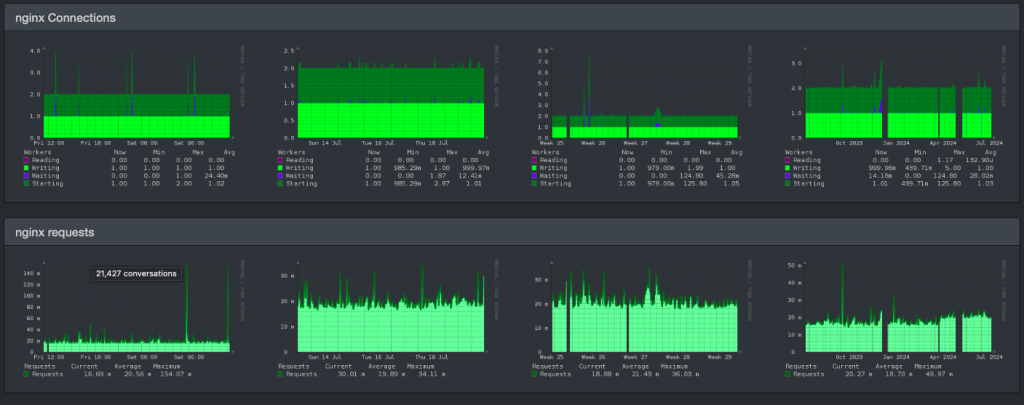
If we look only at the two week view for Nginx Connections, we see the regularly recurring gap, until this morning: no gap.
Here’s an extract from top on Saturday:
Mem: 189M Active, 1329M Inact, 19G Wired, 73G Free
ARC: 14G Total, 4143M MFU, 7288M MRU, 5260K Anon, 88M Header, 2506M Other
     9654M Compressed, 24G Uncompressed, 2.58:1 Ratio
Swap: 40G Total, 40G Free
Now we have only 14G used by ARC – but that’s only 9GB compressed – that’s about 25% of what it was yesterday.
In conclusion
In conclusion, I spent more than tracking down the cause than I did noticing the symptoms (gap in data) and fixing it (ZFS ARC limit). I think that’s because I was sure the problem was the Bacula backup of this host. The actual cause turned out to be the rsync of the Bacula database dump to this host. That’s the daily backup of the Bacula Catalog. I rsync it from my basement to other hosts as an easily-obtainable additional copy.
Hope this was fun for you.


